Download

1 / 50
510 likes | 744 Views
Developing a Statewide Early Warning System. Doug White, DPI Jared Knowles, DPI. Presentation on Wednesday, February 13 th 26th Annual Management Information Systems [MIS] Conference, Washington DC. Early Warning System. Overview What does E arly W arning S ystem mean?

E N D
Developing a Statewide Early Warning System Doug White, DPI Jared Knowles, DPI Presentation on Wednesday, February 13th 26th Annual Management Information Systems [MIS] Conference, Washington DC
Early Warning System Overview What does Early Warning System mean? How can it work in Wisconsin? What other systems does it leverage? What will it look like now? What does the future hold? When can you have it?
Executive Summary Statewide Longitudinal Data Systems enable a new type of EWS Wisconsin DPI has developed such an EWS, and will deploy it statewide in 2013; pilot next month The DPI EWS is fully modular, open source, and extensible When can you have it?
DPI’s System is in Development More than 60% of studentswho eventually do not graduate after 4 years of high school can be identified with current data before the start of 7th grade DPI is working to improve this through better techniques to allow students to be identified earlier and with more accuracy The system will continually improve with better data, better mathematical models, and more real time results
Early Warning System Early: Identify students at risk soon enough to allow time for effective interventions Warning: Provide sense of possible negative outcomes to a student, not absolute System: A cycle of identification, intervention, evaluation, and learning—continuous feedback loops
Why early is so important! Earlier interventions are more effective and less costly More planning time and careful consideration can be made with earlier warning Parents can use information to support students during key middle grades Students can exit at any time during high school, but in middle school exit is much more difficult
Why now? Finally have enough longitudinal data to observe students in both middle school and through completion of high school to draw comparisons Consistent measures statewide allow a full picture Part of our State Superintendent’s agenda! Statewide data means many more patterns of student outcomes prior to graduation / non-completion can be combined and analyzed
Early Warning System What EWS IS: • A tool to identify struggling students early enough to intervene • A way to target interventions based on data • Like a “service engine soon” light in cars What EWS is NOT: • An accountability system • 100% accurate • The solution to student problems
Early Warning System Uses data already collected by DPI to identify student outcomes linked to dropout and late graduation Reports student names/ids, risk scores and risk reasons to school districts via WISEdash Provides examples of effective strategies to prevent dropout
EWS in a MLSS • What student data is collected? • ISES and WKCE/Assessment Data • attendance • assessment • discipline • location • Future: SIS data, EWS can improve as datasets grow!
EWS in a MLSS • How are students identified? • Use data from previous cohorts statewide to identify students with same characteristics as dropout, late graduates • Generate secure reports to school districts via WISEdash
EWS in a MLSS • EWS combined with local data: • Schools review identified students and compare them with local/real time data • Schools share information with and get input from parents • Schools use EWS risk score and local knowledge to determine current risk
EWS in a MLSS • Select and implement interventions: • Schools use risk data with other data, parent input and RTI methods to support student positive behavior, engagement and learning • Review best practices, local initiatives and identify alignment with student needs • Select/implement interventions
EWS in a MLSS • Track outcomes: • Monitor interventions and student outcomes • Compare student outcomes with interventions to learn “what works” • Provide real time feedback to answer the “what next?” question • Share interventions across districts and schools
Inputs and Outputs of EWS Inputs • ISES / WSAS / SBAC • Attendance • Discipline • SIS • Interventions Outputs • Student-specific identification • WISEdash Dashboard • RTI module • Local analysis NOW LATER
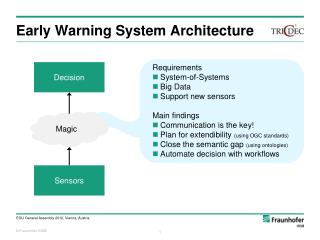
Knowledge LOCAL KNOWLEDGE STATE DATA Teacher / program context Parent input Special circumstances CONTEXT Assessments Demographics Intervention Strategies Attendance Disciplinary Events Mobility Location Student Risk Identification
What does it look like? DPI is ready to roll out the first pieces of this system: • Identify students at risk for dropout or late graduation • Use 7th grade data to identify students less likely to graduate on time by looking at how previous graduates and non-graduates performed in 7th grade • Which 7th grade indicators are warning signs for the student? • Deliver information in WISEdash • Provide links to information on effective strategies for dropout prevention
Can that work? • More than 60% of studentswho do not graduate after 4 years of high school can be identified with current data before the start of 8th grade • DPI is working to improve this through better techniques to allow students to be identified earlier and with more accuracy • The system will continually improve with better data, better mathematical models, and more real time results • This system will be piloted in March 2013, and will be fully operational September of 2013 in Wisconsin, statewide
What do we learn? For each 7th grade student with data, we identify: • The “risk” or “probability” that the student will not complete high school in 4 years • Whether the student is above or below a risk threshold • The parts of the student’s record that are the strongest indicators of risk for dropout or late graduation We can combine all of this with all of the other data on the student in WISEdash
Recap • DPI now capable of identifying 7th grade students at risk of dropout or late graduation • Data on specific student risk can be delivered securely through WISEdash • Districts can use risk data with current data and parent input to determine risk and select interventions • Useful for schools and parents • EWS is not part of accountability system
DPI DEWS Features Free and Open Source Platform Fully modular Empirically Derived Flexible Extensible
Free and Open Source • A key feature of the DPI DEWS is that it is built on free and open source technologies • It is a series of 5 modules: • Data import • Data recoding / cleaning • Model selection • Prediction • Data Export • It has some pre-requisites to work
Technologies • The EWS is written for the R open-source statistical computing language • It is a series of modular scripts that perform some basic functions and may not be necessary everywhere • Each module expects data in certain formats and returns data in a specific format • This is entirely local to Wisconsin currently, but improvements made during the pilot phase should allow time to generalize it more
Data Import Extract raw data from an Oracle data warehouse Extract needs all records for a grade of students from grade 7 to graduation Extract will be reused to get data on current grade 7 students for prediction
Data Recoding and Cleaning • Data recoding is the only place that decisions are forced on the statistical model • Administrative records need to be reshaped in a way to fit the statistical procedures • Business rules need to be in place to enforce standardization of fields • Example: FRL is coded as “F”, “R”, “N”, “A”, “P” • Need to reduce this to “F” and “N” or “F”, “R”, and “N” • Use business rules from the Strategic Data Project • Enforce some rules to make statistical model easier to fit (grouping categories to increase cell size)
Model Selection Fit a basic statistical model regressing a subset of the data on students in 7th grade on an indicator of whether or not they graduated More variables are added to the model, and the prediction rate of each successive model is evaluated on a test set of data Finally, when all variables have been exhausted, or the best possible prediction rate has been achieved, the process is stopped This is repeated for other classes of models / functional forms until the best model from the best of each class is identified
Model Selection • Depending on the data available, the factors included in the model will change, as will their weight in predicting the outcome • The system is flexible to this, so it can expand as new data comes online, and as more longitudinal data is available on cohorts • For now, in Wisconsin, for two cohorts, these factors seem to matter • Assessments — Attendance — Mobility — Discipline • School of attendance
ROC Curve Receiver Operating Characteristic (ROC): A measure of signal to noise in binary classification. http://en.wikipedia.org/wiki/Receiver_operating_characteristic
Model Types Models Tried: • Probit (winner) • Logit • HLM • k-nearest neighbors (knn) • Gradient Boosted Machine • Random Forests Models Yet Tried: • Cubist • Support Vector Machines • Multivariate Adaptive Regression Splines • Discriminant Analysis • Neural networks • Bayesian Model Averaging Currently a manual process, automation is the next step
Prediction Prediction is handled by determining the risk score of an individual student and the uncertainty around that score A threshold is set above which students are flagged Districts will see both the score and the flag The flag is based on a predetermined level of confidence in the prediction e.g. 50% of flagged students are true dropouts, 50% are false negatives
Reporting Predictions are output to a data store, where they are loaded into our statewide reporting instance via ETL Working on building the prediction module into the ETL process (easily done) Allows the scores to be updated when new data are available Crucial as state transitions to a Statewide Student Information System, allowing more frequent updates on data Theoretically any reporting environment could be hooked up to the system SAMPLE REPORTS
Requirements • Requirements • One cohort of students who has valid and reliable measurements of several attributes in the prediction year, and observed graduation, dropout, or transfer • Serious computing resources (depending on data size and complexity) • Preferences • Multiple measures and more than one cohort • No selection bias in students in the data
Flexibility • Open source code that can be viewed, modified, copied, enhanced • System is built on few assumptions; it learns from the data it is fed • Can input data from a variety of formats and output data in a variety of formats (JSON, SQL, ORACLE, CSV, etc.) • Modular—use only the pieces needed
Empirically Derived • The predictive model does not make assumptions about factors that increase or decrease risk • Searches among data provided to identify the combination of factors that provide the best prediction • Factors that matter more are given more weight, those that matter less are discarded • Depending on the data available this may dramatically change • With the data provided, the system will search for the best available model
Recap • Each student receives a score from 0 to 1 (or 0-100) representing the probability of graduation in 4 years of HS • DPI can transform this into a binary indicator (on-track, not-on-track) based on historical information about the prediction (above or below a threshold) • DPI can work on calibrating this binary indicator
Contact Information Jared Knowles E-mail : jared.knowles@dpi.wi.gov Web : www.jaredknowles.com Twitter : @jknowles Questions & DISCUSSION