Download
1 / 32
320 likes | 503 Views
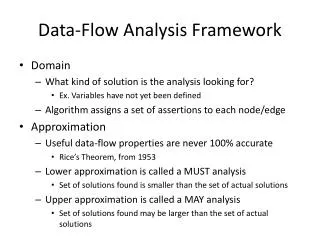
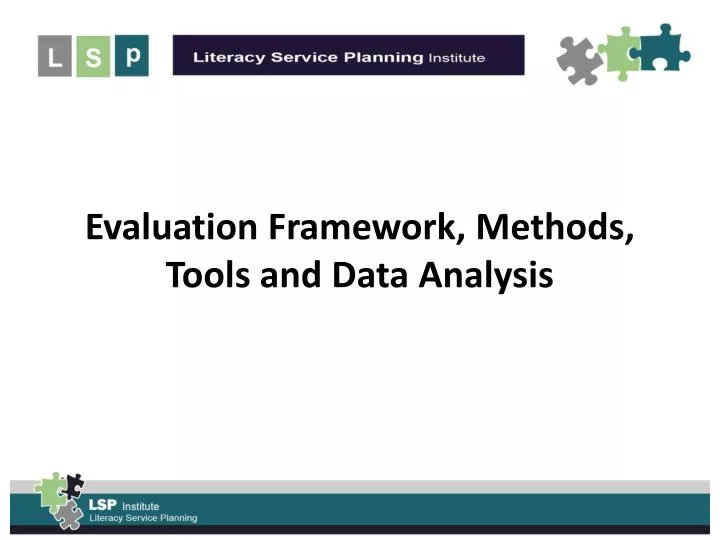
Evaluation Framework, Methods, Tools and Data Analysis. Agenda. Why Evaluate? Evaluation Framework Purpose of the Evaluation Evaluation Plan (Methods, Sample) Evaluation Tools Analyse and Summarize Results Presenting Information Wrap Up and Questions. Discussion Questions:.

E N D
Agenda Why Evaluate? Evaluation Framework Purpose of the Evaluation Evaluation Plan (Methods, Sample) Evaluation Tools Analyse and Summarize Results Presenting Information Wrap Up and Questions
Discussion Questions: • What do you currently evaluate in the literacy service planning process? • Why do you conduct evaluations?
Why Evaluate? • Provide an opportunity to assess and correct your course on an ongoing basis • Evaluation is important for accountability purposes • Evaluation is important for learning – which leads to better quality practice when widely shared
Determine how the Literacy Service Plan has fared in action • Assess the effectiveness of the Literacy Service Plan in terms of its perceived intentions and results • Assess the effectiveness of the literacy service planning process (to be able to make improvements in the process)
Evaluation Framework Identify the purpose of, and audience for, the evaluation results Identify what information needs to be collected and from whom Select from different research methods Select sample/population Design evaluation tools Administer evaluation tools Analyze and summarize results Present information
Identify the Purpose and Audience of the Evaluation Results • Need to be clear about the purpose of the evaluation. What are you evaluating? Five Forms of Evaluation • Effort evaluation – inputs • Performance evaluation – outputs • Effectiveness evaluation – outcomes • Efficiency evaluation – costs • Process evaluation – what worked well and how could the process be improved
Formative or summative evaluation? Formative Evaluation • To collect information that can be used primarily for development and improvement Summative Evaluation • To make an overall judgement about the effectiveness of a program/service/process
When you construct your evaluation questions, you will refer back to the purpose of the evaluation to make sure the questions you ask will produce the information you want
Discussion Question: • Which form(s) of evaluation would you use in the literacy service planning process and why? • Effort evaluation – inputs • Performance evaluation – outputs • Effectiveness evaluation – outcomes • Efficiency evaluation – costs • Process evaluation – what worked well and how could the process be improved
Develop an Evaluation Plan Purpose of the Evaluation
Research Methods Two basic ways to collect information:
Samples Questions to Ask: • How many people or pieces of print material should be included in your evaluation? • Which people or print material should be included in your evaluation? • How should they be selected?
Evaluation Tools Questions are the key! • Questionnaires/Surveys • Key Informant Interviews • Focus Groups
Designing Questions • Closed and open ended questions • For written surveys, list all possible options for closed questions, including “no opinion” or “don’t know”
Open Ended What are your hobbies? (please list below) _______________________________ Closed What are your hobbies? (please select all responses that apply to you) • Reading • Running • Knitting • Eating • Other (please list): ___________________ Do you like ice cream? (please select the most appropriate response) • Yes • No • Don’t Know
Be sure that questions are neutral - watch out for the halo effect • Ask questions so that people can admit to none of the responses (what, if any,…) • Avoid agree or disagree statements • Avoid double-barrelled questions
Double-Barrelled Questions: • What feedback do you have about our parenting groups and our youth groups? • How would you rate your level of satisfaction with our volunteer training program and ongoing support for volunteers?
Avoid: • Sensitive or embarrassing questions • Double negatives (Do you agree or disagree that nonprofits should not receive government funding?) • Too many alternatives • Unimportant questions • Complex language (jargon)
Analyze and Summarize Results • What do you do with all of the information you’ve gathered?
Data Analysis Quantitative Data • Data which describes reality using numbers Qualitative Data • Data which describes events, persons, etc. without the use of numbers (words)
Quantitative Data Analysis • Tabulate the # of responses for each category in the questions • Average, range, most frequent response • 62% of clients are satisfied with the services provided by our organization • Youth programs received an average rating of 3.5 out of 4 • All services were rated between 2.82 and 3.43 out of 4
Qualitative Data Analysis • Read the responses and identify general themes • Sort each individual response into themes • Count # of responses in each theme to determine priority
Considering Findings Four processes to make sense of evaluation findings: • Description and Analysis • Interpretation • Judgement • Recommendations
Description and Analysis: Organizing the raw data into a form that reveals the basic results. Presents the facts of the case and the actual data Interpretation: This goes beyond the data to meaning and significance. What do the results mean? What’s the significance of the findings? Why did the findings turn out this way? What are the possible explanations?
Judgement: Bringing values to bear on the analysis and interpretations. To what extent and in what ways are the results positive or negative? What is good, bad, desirable or undesirable? Recommendations: What should be done? What are the action implications of the findings?
Presenting Information • Pie chart • Flow charts • Line graphs • Tables • Data needs to be arranged, ordered and presented in a reasonable format that allows readers to quickly detect patterns in the data • Visual presentations of information: • Bar graph • Scatterplot • Figures (graphs and other diagrams)
Bar Graph Pie Chart
Scatter Plot Flow Chart Line Graph
Reflection • What learnings and reflections do I have from this session? • What are some potential actions for my Regional Network?
References • Ministry of Tourism and Recreation. (1982) Enjoying Research. Government of Ontario. • Patton, Michael Quinn. (1986) Utilization-Focused Evaluation. California: SAGE Publications.