Download
1 / 1
10 likes | 114 Views
MICROBIAL DYNAMICS IN CONVENTIONAL AND ORGANIC MANAGED SYSTEMS. LACHNICHT WEYERS, S.L., ARCHER, D.A., JOHNSON, J., WILTS, A., BARBOUR, N., AND EKLUND, J. USDA ARS North Central Soil Conservation Research Laboratory, Morris MN. MICROBIAL BIOMASS. METHODS Soil Sampling:

E N D
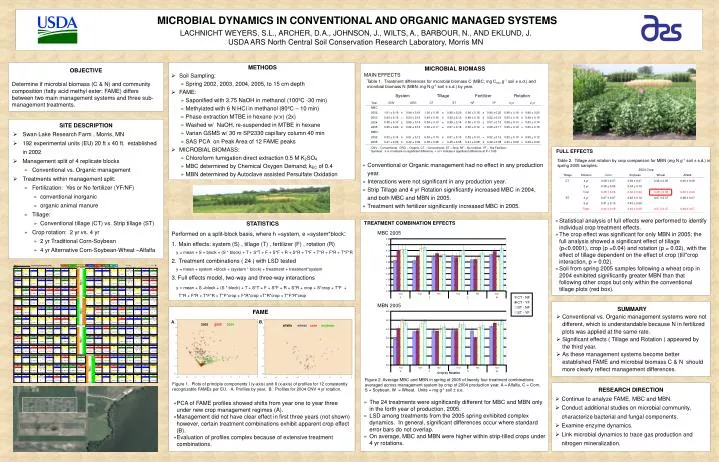
MICROBIAL DYNAMICS IN CONVENTIONAL AND ORGANIC MANAGED SYSTEMS LACHNICHT WEYERS, S.L., ARCHER, D.A., JOHNSON, J., WILTS, A., BARBOUR, N., AND EKLUND, J. USDA ARS North Central Soil Conservation Research Laboratory, Morris MN MICROBIAL BIOMASS • METHODS • Soil Sampling: • Spring 2002, 2003, 2004, 2005, to 15 cm depth • FAME: • Saponified with 3.75 NaOH in methanol (100ºC -30 min) • Methylated with 6 N HCl in methanol (80ºC – 10 min) • Phase extraction MTBE in hexane (v:v) (2x) • Washed w/ NaOH, re-suspended in MTBE in hexane • Varian GSMS w/ 30 m SP2330 capillary column 40 min • SAS PCA on Peak Area of 12 FAME peaks • MICROBIAL BIOMASS: • Chloroform fumigation direct extraction 0.5 M K2SO4 • MBC determined by Chemical Oxygen Demand; kEC of 0.4 • MBN determined by Autoclave assisted Persulfate Oxidation OBJECTIVE Determine if microbial biomass (C & N) and community composition (fatty acid methyl ester; FAME) differs between two main management systems and three sub-management treatments. MAIN EFFECTS Table 1. Treatment differences for microbial biomass C (MBC; mg Cmic g-1 soil ± s.d.) and microbial biomass N (MBN, mg N g-1 soil ± s.d.) by year. System Tillage Fertilizer Rotation Year CNV ORG CT ST NF YF 4 yr 2 yr MBC 2002 1.01 ± 0.19 ≥ 0.94 ± 0.19 1.00 ± 0.18 ≥ 0.95 ± 0.20 0.96 ± 0.18 ≥ 0.99 ± 0.20 0.98 ± 0.19 ≥ 0.96 ± 0.20 2003 0.50 ± 0.15 = 0.50 ± 0.16 0.49 ± 0.16 ≤ 0.50 ± 0.15 0.48 ± 0.15 ≤ 0.52 ± 0.16 0.50 ± 0.16 ≥ 0.49 ± 0.16 2004 0.58 ± 0.13 ≥ 0.55 ± 0.14 0.54 ± 0.13 < 0.59 ± 0.14 0.55 ± 0.13 ≤ 0.57 ± 0.13 0.58 ± 0.13 > 0.53 ± 0.14 SITE DESCRIPTION • Swan Lake Research Farm , Morris, MN • 192 experimental units (EU) 20 ft x 40 ft. established in 2002 • Management split of 4 replicate blocks • Conventional vs. Organic management • Treatments within management split: • Fertilization: Yes or No fertilizer (YF/NF) • conventional inorganic • organic animal manure • Tillage: • Conventional tillage (CT) vs. Strip tillage (ST) • Crop rotation: 2 yr vs. 4 yr • 2 yr Traditional Corn-Soybean • 4 yr Alternative Corn-Soybean-Wheat –Alfalfa 2005 0.65 ± 0.20 ≥ 0.62 ± 0.16 0.60 ± 0.17 < 0.67 ± 0.18 0.60 ± 0.19 < 0.66 ± 0.17 0.65 ± 0.19 > 0.60 ± 0.15 MBN 2002 0.53 ± 0.14 ≥ 0.51 ± 0.12 0.53 ± 0.13 ≥ 0.51 ± 0.13 0.52 ± 0.13 = 0.52 ± 0.13 0.53 ± 0.13 ≥ 0.50 ± 0.12 2005 0.41 ± 0.09 ≤ 0.42 ± 0.09 0.38 ± 0.08 < 0.45 ± 0.08 0.41 ± 0.08 ≤ 0.42 ± 0.08 0.43 ± 0.09 > 0.39 ± 0.09 Table 2. Tillage and rotation by crop comparison for MBN (mg N g-1 soil ± s.d.) in spring 2005 samples. 0.90 CNV – Conventional, ORG – Organic, CT – Conventional, ST – Strip, NF – No fertilizer, YF – Yes Fertilizer, Symbols: ≤ or ≥ indicate no significant difference, < or > indicate a significant difference at P < 0.05. FULL EFFECTS 2004 Crop 0.80 Tillage Rotation Corn Soybean Wheat Alfalfa 0.70 • Conventional or Organic management had no effect in any production year. • Interactions were not significant in any production year. • Strip Tillage and 4 yr Rotation significantly increased MBC in 2004, and both MBC and MBN in 2005. • Treatment with fertilizer significantly increased MBC in 2005. CT 4 yr 0.38 ± 0.07 0.39 ± 0.07 0.45 ± 0.05 0.36 ± 0.09 0.60 2 yr 0.38 ± 0.06 0.34 ± 0.10 0.50 Total 0.38 ± 0.06 0.36 ± 0.09 0.45 ± 0.05 0.36 ± 0.09 0.40 ST 4 yr 0.47 ± 0.07 0.45 ± 0.10 0.47 ± 0.07 0.48 ± 0.07 0.30 2 yr 0.41 ± 0.10 0.43 ± 0.09 0.20 Total 0.44 ± 0.09 0.44 ± 0.09 0.47 ± 0.07 0.48 ± 0.07 0.10 0.00 four four two four two four A C S W 0.60 • Statistical analysis of full effects were performed to identify individual crop treatment effects. • The crop effect was significant for only MBN in 2005; the full analysis showed a significant effect of tillage (p<0.0001), crop (p =0.04) and rotation (p = 0.02), with the effect of tillage dependent on the effect of crop (till*crop interaction, p = 0.02). • Soil from spring 2005 samples following a wheat crop in 2004 exhibited significantly greater MBN than that following other crops but only within the conventional tillage plots (red box). TREATMENT COMBINATION EFFECTS 0.50 MBC 2005 0.40 CT - NF 0.30 CT - YF ST - NF ST - YF 0.20 0.10 0.00 four four two four two four A C S W MBN 2005 • SUMMARY • Conventional vs. Organic management systems were not different, which is understandable because N in fertilized plots was applied at the same rate. • Significant effects ( Tillage and Rotation ) appeared by the third year. • As these management systems become better established FAME and microbial biomass C & N should more clearly reflect management differences. FAME A. B. 2002 20032004 • alfalfawheat cornsoybean Crop by Rotation Figure 2. Average MBC and MBN in spring of 2005 of twenty four treatment combinations averaged across management system by crop of 2004 production year. A = Alfalfa, C = Corn, S = Soybean, W = Wheat. Units = mg g-1 soil ± s.e. Figure 1. Plots of principle components I (y-axis) and II (x-axis) of profiles for 12 consistently recognizable FAMEs per EU. A. Profiles by year, B. Profiles for 2004 CNV 4 yr rotation. • RESEARCH DIRECTION • Continue to analyze FAME, MBC and MBN. • Conduct additional studies on microbial community, characterize bacterial and fungal components. • Examine enzyme dynamics. • Link microbial dynamics to trace gas production and nitrogen mineralization. • The 24 treatments were significantly different for MBC and MBN only in the forth year of production, 2005. • LSD among treatments from the 2005 spring exhibited complex dynamics. In general, significant differences occur where standard error bars do not overlap. • On average, MBC and MBN were higher within strip-tilled crops under 4 yr rotations. • PCA of FAME profiles showed shifts from year one to year three under new crop management regimes (A). • Management did not have clear effect in first three years (not shown) however, certain treatment combinations exhibit apparent crop effect (B). • Evaluation of profiles complex because of extensive treatment combinations. • STATISTICS • Performed on a split-block basis, where h =system, e =system*block: • Main effects: system (S) , tillage (T) , fertilizer (F) , rotation (R) • y = mean + S + block + (S * block) + T + S*T + F + S*F + R + S*R + T*F + T*R + F*R + T*F*R • Treatment combinations ( 24 ) with LSD tested • y = mean + system +block + (system * block) + treatment + treatment*system • 3. Full effects model, two-way and three-way interactions • y = mean + S +block + (S * block) + T + S*T + F + S*F + R + S*R + crop + S*crop + T*F + T*R + F*R + T*F*R + T*F*crop + F*R*crop +T*R*crop + T*F*R*crop