Download
1 / 42
420 likes | 602 Views
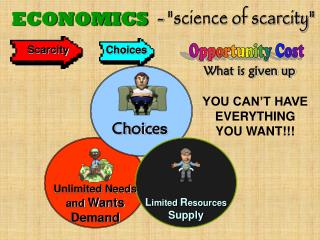
Economics. Basic Concepts & Demand. Economics is about…. Scarce Resources. Limited Means. Unlimited Wants. Choices. Opportunuity Costs. Scarcity. Resources are limited (scarce) Our wants are Unlimited We have limited means to satisfy our unlimited wants Limited Income

E N D
Economics Basic Concepts & Demand
Economics is about… Scarce Resources Limited Means Unlimited Wants Choices Opportunuity Costs
Scarcity • Resources are limited (scarce) • Our wants are Unlimited • We have limited means to satisfy our unlimited wants • Limited Income • Limited Time • Limited Skills
“Means” also have a cultural dimension. • “Means” can also include family, & for Maori, there is the Whanau, Hapu (Sub Tribe), & Iwi (tribe) support, as well as the distribution of Maori fishing resources & other Treaty settlements. • The ability to collect fish/seafood under customary rights can add to a person’s means. (i.e. providing access to fishing resources that are unavailable to others).
What does this mean? Can many of your needs & wants be satisfied by your family? • E.g. Love, Protection, Support and or Accommodation. For Maori both Whanau and the Iwi or Hapu can provide more ways to satisfy needs and the wants. • E.g. Scholarships, Housing, Education, Culture
Cultural Means In Practice • Explain how customary fishing rights can increase a tribe’s means? • On a marae near the beach some of the women of the local iwi (tribe) weave baskets using flax that grows nearby. In contrast, the Riley’s tend to buy a bag or basket when they need one. • What does this tell us about the way various groups solve economic problems? • State the economic problem that requires people and groups to make choices. (NCEA)
Choice • Every time we make a choice we miss out on the next best alternative • Opportunity Cost = “the next best alternative forgone when a decision is made”
Goods and Services • Goods = Physical items you can see or touch (tangible) • Services = when you pay people to do something for you (Intangible) Sort the following into goods and services and then add 4 more to each list: Snowboard, haircut, tennis racquet, tennis lesson, video hire, video player, ice-cream.
Types of Goods • Free Goods=goods that are not scarce and therefore have no price • E.g. Rain-water, sand on the beach • Economic Goods=goods that are scarce and have a price • Consumer Goods= used by consumers • Capital Goods= used by producers to make other goods & services
What is Demand? Demand is what Consumers are willing and able to purchase at given prices. This is shown in a Demand Schedule and a Demand Curve. Key Terms: • Consumers = People who buy goods & Services • Demand = Willing to purchase
Demand Demand Schedule = a table showing combinations of price and quantity demanded
Demand Curve = a graph plotting combinations of price and quantity demanded Title Labels & Units on axes Scale even Plot Points joined Labelled curve D Best Mnemonic challenge…
Draw your own Demand Curve from the Demand Schedule for Coke D
Law of Demand When Price decreases, quantity Demanded increases (or When Price increases, quantity Demanded decreases ) P ↑ QD ↓ P ↓ QD ↑ D
Change in Quantity Demanded Change in quantity Demanded = when price changes there is a movement along the demand curve from one quantity to another. D
Memorise it! Law of Demand = As price increases, quantity demanded _____________. Or: As price decreases, ________ __________ _________. A change in ________ causes a movement along the demand curve.
Change in Demand • A demand curve is drawn assuming “ceteris paribus”. • Ceteris Paribus = “all factors affecting demand are held constant except price.” • If any factor apart from price changes, we must shift (move) the demand curve. This is called a change in demand.
Increase in Demand D2 D1 Quantity Demanded has increased at each and every price
An Increase in Demand. A Change in Demand. Ceteris Paribus no longer applies A Decrease in Demand. Price $ Price $ 5 4 3 2 1 0 5 4 3 2 1 0 P1 P1 D1 D D1 D 1 2 3 4 5 6 7 8 9 1 2 3 4 5 6 7 8 9 Quantity Quantity Q1 Q2 Q2 Q1 Demand has increased from 3 to 7.5 units. Demand has decreased from 7 to 3 units.
Determinants of Demand. (T.I.C.S) • So what are the factors that will cause the entire demand curve to shift? • Tastes and preferences change • Income changes • Complements price change • Advertising • Substitutes price change Iate six chocolate truffles
Income • A person’s income will affect their ability to demand goods and services. As income increases, demand increases. • Eg. Jono spends money on hiring DVD’s each week. • Last year he earned $20 each week, but this year he earns $50 each week.
Tastes and Preferences • A person’s tastes and preferences will influence their willingness to demand. • Many factors can influence our tastes and preferences: • Age • Gender • Culture • Upbringing • Fashion • Peers • Advertising • Season • Write your own example for each factor • Choose 3 factors and for each draw a sketch graph to show how your demand has changed for a good
Price of a Substitute • Substitute = a good or service that can be used instead of another good or service. KFC and McD's
When the price of a substitute increases, demand for the other good increases. • Eg. When the price of Coke increases, demand for Pepsi increases. Demand Curve for Coke Demand Curve for Pepsi P2 P1 D2 D1 D1 Q1 Q2
Price of a Complement • Complement = a good or service that can be used with another good or service. Bread and Butter
When the price of a complement decreases, demand for the other good increases. • Eg. When the price of Play stations decreases, demand for Play station games increases. PS2 PS2 Games P1 P2 D2 D1 D1 Q2 Q1
Aggregate Household Patterns • The economy is made up of many households. Each household demands a wide range of products. • Aggregate refers to the whole economy, and includes every households demand for all goods and services • There is a strong relationship between aggregate household income, saving and consumption. • Any factor that affects aggregate household income will have an impact on aggregate household spending and saving.
Types of Goods • Inferior Goods = Goods that when income increases demand decreases eg. No frills toilet paper, baked beans. • Normal Goods = basic necessities that when income increases demand increases. Eg. Bread, school uniform • Luxury Goods = goods we desire. As income increases households switch to more luxuries.
The Relationship Between Aggregate Spending and Household Income. As income increases, so does spending on necessities As income increases,the % spent (proportion) decreases as households substitute necessities (& inferior goods) for luxury goods Spending Necessities e.g. clothing, food, shelter Income
The Relationship Between Aggregate Spending and Household Income. As income increases the $ spending on luxuries increases Spending As income increases the % of income spent on luxuries also increases Luxuries and other services e.g. health insurance… Income
The Relationship Between Aggregate Spending and Household Income. At low income levels households do not save.(all income is spent) As income increases the amount saved increases and the % of income saved increases. $ Savings Income
Quick Maths Lesson… • Converting Numbers into a % • amount / total x 100 • eg. Ji Eun Saves $40 out of $500 each week • 40 / 500 x 100 = 8% • Simplifying a ratio • divide both sides by the same number • 12% : 33% ( divide by 3) • 4 : 11
Quick Maths Lesson… • % of an amount • % / 100 x amount • Eg. 40% of $600 • 40 / 100 x $600 = $240 • Mean = average (Total / no. of items) • Median = middle (Put in order first) • Mode = most common • Range = biggest - smallest
Values • core beliefs or principles that affect what we do or think • Values affect the economic decisions consumers make
Values Positions • The death penalty for murder should be introduced • Gay marriage should be allowed • Year 11 is too young to be having sex • Abortion is a right everyone should have • Marjuana should be decriminalised • The drinking age should be raised to 20 Strongly Agree Disagree Strongly Agree Disagree
making decisions to please the family or following family traditions. • concern for the future • selling in an honest and fair way • getting value for money • following laws/doing the 'right thing.' • linked to the idea of always working hard. • Being able to do what you like • following a popular image • love of your country. • wanting a 'fair go' for the under-privileged. • feminism – fairness for each sex
The Simpsons and their Values Choose at least 4 of the Simpsons characters and for each one explain what their values are. Give an example that shows their values affecting a decision they have made.
Influence on our Values • For each influence: • give an example of how it could affect one of your values • givean example of it affecting an economic decision. • Eg. Media: Liz is addicted to magazines and TV and now values youth/beautyfashion. • She spends lots of $ on make-up and clothes • Upbringing • Age / experience • Cultural beliefs • Peer pressure • Religious beliefs • Gender • Media
Market Demand • A market is made up of more than one Consumer • Market Demand = the sum of individual demand at each and every price • It is calculated by horizontally adding individual demand curves at each and every price.
Demand for Potatoes Add it up and Graph it!