Download
1 / 25
250 likes | 383 Views
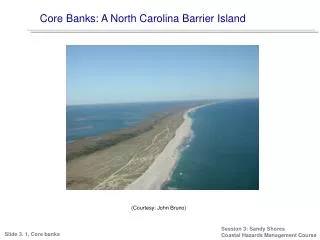
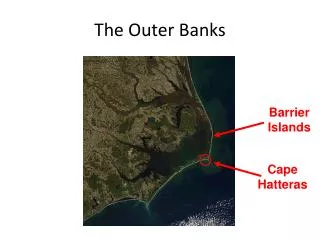
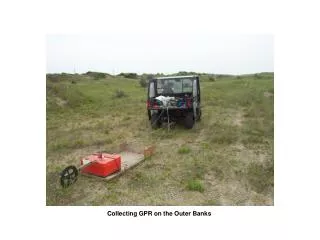
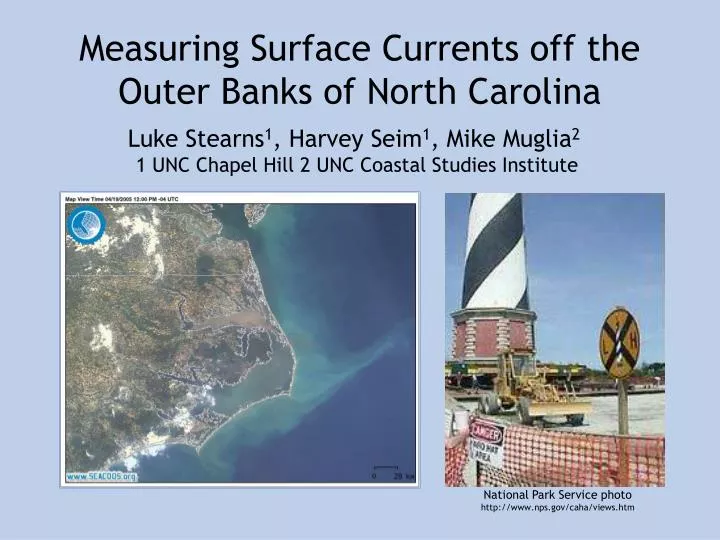
Measuring Surface Currents off the Outer Banks of North Carolina. Luke Stearns 1 , Harvey Seim 1 , Mike Muglia 2 1 UNC Chapel Hill 2 UNC Coastal Studies Institute. National Park Service photo http://www.nps.gov/caha/views.htm. Site Locations. Synopsis. System Changes

E N D
Measuring Surface Currents off the Outer Banks of North Carolina Luke Stearns1, Harvey Seim1, Mike Muglia2 1 UNC Chapel Hill 2 UNC Coastal Studies Institute National Park Service photo http://www.nps.gov/caha/views.htm
Synopsis • System Changes • Variations in Coverage • Antenna Pattern Measurement • Radio Frequency Noise • ADCP Comparison • Gulf Stream Position & Shelf Break Currents
Hatteras Radials and Events 4.55 4.80 4.47
Duck Radials and Events 4.80 4.47 4.55 4.53
Daily Medians Hurricane Isabel
Antenna Pattern Measurement 2003/06/26 2003/12/12 Duck Patterns 2004/12/06 2004/12/06
Antenna Pattern Measurement Hatteras Patterns 2003/06/24 2004/05/25 2004/06/08
Noise in the Spectral Data 2004/12/12 00:00 18:00
Radio Frequency Noise 2004/12/12 Duck Tx 00:00 18:00
Noise in the Spectral Data 2003/12/03 Duck Hatteras 02:00 08:00 14:00
Radio Frequency Noise 2003/12/03 02:00 08:00 14:00
ADCP Mooring Location ADCP Location
ADCP Comparison Measured Beam Patterns
ADCP Comparison Ideal Beam Patterns
Hovmoller Line Hovmoller Line: 35.5
Summary • Coverage varies significantly • Many factors may influence data quality: • Radio Frequency noise • Antenna Pattern Measurements • Antenna position and transmit frequency • ADCP Comparison shows mediocre results • APMs effect the data but quality may be similar • Gulf Stream Front effects shelf currents
Future Work • Compare Codar radials to ADCP’s directional components • Frequency decomposition of both datasets • Develop better outlier identification procedures • Compare with ship-track ADCP from Gawarkiwecz and Savidge cruise (Fall 2004) • Look at quantification of the Gulf Stream Front and its effects on shelf flow
Thanks • Harvey Seim (Ideas, Money) • Mike Muglia (Ideas, Upkeep) • CodarOS (Great support) • ROWG (Sharing of Ideas) • SEACOOS (Funding, Ideas) • You all for listening and sharing expertise!