Download
1 / 72
720 likes | 733 Views
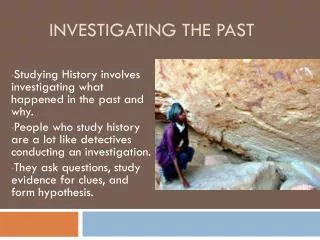
Investigate how biologists reconstruct and interpret phylogenies using systematics, emphasizing the evolution of legless lizards and snakes from original lineages. Understand Linnaean classification, hierarchical organization, and linking classification with phylogeny. Learn about homologies, analogies, and how systematists represent evolutionary relationships. Explore the significance of phylogenetic trees in inferring species identities and evolutionary connections.

E N D
Objective 4:TSWBAT describe how biologists reconstruct and interpret phylogenies using systematics.
Overview: Investigating the Evolutionary History of Life Legless lizards and snakes evolved from different lineages of lizards with legs Legless lizards have evolved independently in several different groups through adaptation to similar environments
Figure 20.2 No limbs Eastern glass lizard Monitor lizard Iguanas ANCESTRAL LIZARD (with limbs) Snakes No limbs Geckos
Phylogeny is the evolutionary history of a species or group of related species The discipline of systematics classifies organisms and determines their evolutionary relationships
Concept 20.1: Phylogenies show evolutionary relationships Taxonomy is the ordered division and naming of organisms In the 18th century, Carolus Linnaeus published a system of taxonomy based on resemblances Two key features of his system remain useful today: two-part names for species and hierarchical classification
The two-part scientific name of a species is called a binomial The first part of the name is the genus The second part, called the specific epithet, is unique for each species within the genus The first letter of the genus is capitalized, and the entire species name is italicized Both parts together name the species (not the specific epithet alone)
Hierarchical Classification Linnaeus introduced a system for grouping species in increasingly broad categories The taxonomic groups from narrow to broad are species, genus, family, order, class, phylum, kingdom,and domain
Figure 20.3 Species: Panthera pardus Genus: Panthera Family: Felidae Order: Carnivora Class: Mammalia Phylum: Chordata Kingdom: Animalia Domain: Bacteria Domain: Archaea Domain: Eukarya
A taxonomic unit at any level of hierarchy is called a taxon The broader taxa are not comparable between lineages For example, an order of snails has less genetic diversity than an order of mammals
Linking Classification and Phylogeny Systematists depict evolutionary relationships in branching phylogenetic trees
Figure 20.4 1 2 Order Family Genus Species Panthera pardus (leopard) Felidae Panthera Taxidea taxus (American badger) Taxidea Carnivora Mustelidae Lutra lutra (European otter) Lutra Canis latrans (coyote) Canidae Canis Canis lupus (gray wolf)
Linnaean classification and phylogeny can differ from each other Systematists have proposed that classification be based entirely on evolutionary relationships A phylogenetic tree represents a hypothesis about evolutionary relationships Each branch point represents the divergence of two taxa from a common ancestor Sister taxa are groups that share an immediate common ancestor
A rooted tree includes a branch to represent the most recent common ancestor of all taxa in the tree A basal taxon diverges early in the history of a group and originates near the common ancestor of the group A polytomy is a branch from which more than two groups emerge
Figure 20.5 1 2 3 4 5 Branch point: where lineages diverge Taxon A Taxon B Sister taxa Taxon C Taxon D Taxon E ANCESTRAL LINEAGE Taxon F Basal taxon Taxon G This branch point represents the common ancestor of taxa A−G. This branch point forms a polytomy: an unresolved pattern of divergence.
What We Can and Cannot Learn from Phylogenetic Trees Phylogenetic trees show patterns of descent, not phenotypic similarity Phylogenetic trees do not generally indicate when a species evolved or how much change occurred in a lineage It should not be assumed that a taxon evolved from the taxon next to it
Applying Phylogenies Phylogeny provides important information about similar characteristics in closely related species Phylogenetic trees based on DNA sequences can be used to infer species identities For example: A phylogeny was used to identify the species of whale from which “whale meat” originated
Figure 20.6 Results Minke (Southern Hemisphere) Unknowns 1a, 2, 3, 4, 5, 6, 7, 8 Minke (North Atlantic) Unknown 9 Humpback Unknown 1b Blue Unknowns 10, 11, 12, 13 Fin
Concept 20.2: Phylogenies are inferred from morphological and molecular data To infer phylogeny, systematists gather information about morphologies, genes, and biochemistry of living organisms The similarities used to infer phylogenies must result from shared ancestry
Morphological and Molecular Homologies Phenotypic and genetic similarities due to shared ancestry are called homologies Organisms with similar morphologies or DNA sequences are likely to be more closely related than organisms with different structures or sequences
Sorting Homology from Analogy When constructing a phylogeny, systematists need to distinguish whether a similarity is the result of homology or analogy Homology is similarity due to shared ancestry Analogy is similarity due to convergent evolution Convergent evolution occurs when similar environmental pressures and natural selection produce similar (analogous) adaptations in organisms from different evolutionary lineages
Bat and bird wings are homologous as forelimbs, but analogous as functional wings Analogous structures or molecular sequences that evolved independently are also called homoplasies Homology can be distinguished from analogy by comparing fossil evidence and the degree of complexity The more complex two similar structures are, the more likely it is that they are homologous
Evaluating Molecular Homologies Molecular homologies are determined based on the degree of similarity in nucleotide sequence between taxa Systematists use computer programs when analyzing comparable DNA segments from different organisms
Figure 20.8-1 C A G A C C A T G T C C C C A T G T C C C A G A 1 2 These homologous DNA sequences are identical as species 1 and species 2 begin to diverge from their common ancestor
Figure 20.8-2 C A G A C C A T G T C C C C A T G T C C C A G A C A G A C C A T G T C C C C A T G T C C C A G A 1 2 Deletion 1 2 Insertion G T A Deletion and insertion mutations shift what had been matching sequences in the two species.
Figure 20.8-3 C A G A C C A T G T C C C C A T G T C C C A G A C A G A C C A T G T C C C C A T G T C C C A G A C C A T C A A G T C C G T A C C A T C A G A G T C C 1 2 Deletion 1 2 Insertion G T A 1 2 Of the regions of the species 2 sequence that match the species 1 sequence, those shaded orange no longer align because of these mutations.
Figure 20.8-4 C A G A C C A T G T C C C C A T G T C C C A G A C A G A C C A T G T C C C C A T G T C C C A G A C C A T C A A G T C C G T A C C A T C A G A G T C C C C A T C A A G T C C G T A C C A T C A G A G T C C 1 2 Deletion 1 2 Insertion G T A The matching regions realign after a computer program adds gaps in sequence 1 1 2 1 2
Shared bases in nucleotide sequences that are otherwise very dissimilar are called molecular homoplasies
Figure 20.9 A molecular homoplasy G G C A G T C T A A C G G A T C C A A C T A A C A C T T T G A T C A C C G G G T C T A G These two DNA sequences from organisms that are not closely related coincidentally share 23% of their bases. Statistical tools have been developed to determine whether DNA sequences that share more than 25% of their bases do so because they are homologous.
Concept 20.3: Shared characters are used to construct phylogenetic trees Once homologous characters have been identified, they can be used to infer a phylogeny
Cladistics Cladistics classifies organisms by common descent A clade is a group of species that includes an ancestral species and all its descendants Clades can be nested in larger clades, but not all groupings of organisms qualify as clades A valid clade is monophyletic, signifying that it consists of the ancestor species and all its descendants
Figure 20.10a 1 (a) Monophyletic group (clade) A B Group I C D E F G
A paraphyletic grouping consists of an ancestral species and some, but not all, of the descendants
Figure 20.10b 2 (b) Paraphyletic group A B C D Group II E F G
A polyphyletic grouping consists of various taxa with different ancestors
Figure 20.10c 1 2 (c) Polyphyletic group A B Group III C D E F G
Shared Ancestral and Shared Derived Characters In comparison with its ancestor, an organism has both shared and different characteristics A shared ancestral character is a character that originated in an ancestor of the taxon A shared derived character is an evolutionary novelty unique to a particular clade A character can be both ancestral and derived, depending on the context
Inferring Phylogenies Using Derived Characters When inferring evolutionary relationships, it is useful to know in which clade a shared derived character first appeared
Figure 20.11a TAXA Lancelet (outgroup) Lamprey Leopard Turtle Bass Frog Vertebral column (backbone) 0 1 1 1 1 1 Hinged jaws 1 1 0 1 0 1 Four walking legs 0 0 1 0 1 1 CHARACTERS 0 1 1 0 0 0 Amnion 0 0 1 0 0 0 Hair (a) Character table
Figure 20.11b Lancelet (outgroup) Lamprey Bass Vertebral column Frog Hinged jaws Turtle Four walking legs Amnion Leopard Hair (b) Phylogenetic tree
An outgroup is a species or group of species that is closely related to the ingroup, the various species being studied The outgroup is a group that has diverged before the ingroup Systematists compare each ingroup species with the outgroup to differentiate between shared derived and shared ancestral characteristics
Characters shared by the outgroup and ingroup are ancestral characters that predate the divergence of both groups from a common ancestor
Phylogenetic Trees with Proportional Branch Lengths In some trees, the length of a branch can reflect the number of genetic changes that have taken place in a particular DNA sequence in that lineage In other trees, branch length can represent chronological time, and branching points can be determined from the fossil record
Figure 20.12 Drosophila Lancelet Zebrafish Frog Chicken Human Mouse
Figure 20.13 Drosophila Lancelet Zebrafish Frog Chicken Human Mouse PALEOZOIC MESOZOIC CENOZOIC 251 542 65.5 Present Millions of years ago
Maximum Parsimony Systematists can never be sure of finding the best tree in a large data set They narrow possibilities by applying the principle of maximum parsimony Maximum parsimony assumes that the tree that requires the fewest evolutionary events (appearances of shared derived characters) is the most likely Computer programs are used to search for trees that are parsimonious
Figure 20.14a Technique Species III Species I Species II Three phylogenetic hypotheses: I I III II III II II III I
Figure 20.14b Technique Site 3 2 1 4 C T T Species I A C C T T Species II G A C A Species III T G A T Ancestral sequence
Figure 20.14c Technique 1/C III I I 1/C III II II 1/C III II I 1/C 1/C 3/A 3/A 2/T I I III 2/T 4/C 3/A II II III 4/C 4/C 2/T III I II 3/A 4/C 2/T 3/A 2/T 4/C