Download
1 / 25
250 likes | 389 Views
Where Do the Hurricanes Come From?. Global Climate System. Spatial Scale. Globe. Global warming Multi-decadal Oscillation. Ice age Glacial cycle. El Nino Biennial Oscillation. Continent. Monsoon. Madden-Julian Oscillation Tropical waves Annular modes. Diurnal variation. Heat wave

E N D
Global Climate System Spatial Scale Globe Global warming Multi-decadal Oscillation Ice age Glacial cycle El Nino Biennial Oscillation Continent Monsoon Madden-Julian Oscillation Tropical waves Annular modes Diurnal variation Heat wave Midlatitude cyclone Tropical cyclone State Mesoscale convective system Thunderstorm Tornado City Football field Shallow convection Boundary layer turbulence 1 mm Vapor/Cloud/precipitation 1 m Radiation Composition 10-4m 10-15sec 1sec 1min 1day 1mon 1yr 10yr 100yr 100,000yr Time Scale
The most common atmospheric circulation structure H L Radiation Convection Cooling or No Heating Heating Latent/Sensible Conduction H L Land/Ocean/Ice Feedback • Imbalance of heating • Imbalance of temperature • Imbalance of pressure • Wind
Video: Anatomy of a Hurricanehttp://www.youtube.com/watch?v=HJydFJORWf4
Observation of tropical cyclones: Aircrafts (The hurricane hunters)
Genesis and tracks of tropical cyclones 5.4 2.5 8.9 16 4.4 3.4 4.3 • Different names: hurricanes, typhoons, cyclones • Genesis region generally in the tropics, especially between 5N-15N and 5S-15S. • Western Pacific has the highest average number of tropical cyclones per year
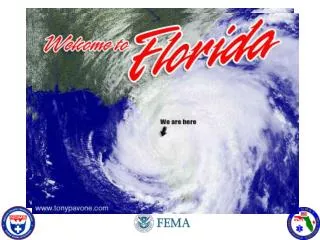
Necessary environmental conditions for tropical cyclone formation • SST > 27 oC (Poleward of about 20o SST too cold for formation. Highest frequency in late summer to early autumn when water is warmest.) • Warm ocean mixed layer is thick enough to supply energy (this is why they weaken quickly upon landfall) • Unstable atmosphere with a moist lower/middle troposphere (central and western ocean basins) • Low vertical windshear (Otherwise upward transfer of latent heat disrupted) • Coriolis force (do not form between 5N-5S where Coriolis force is too weak) • Pre-existing low-level rotating circulations (tropical waves and other disturbances)
Four stages of tropical cyclone formation Vortex w/ max wind >74 mph Vortex w/ max wind 39-73 mph Vortex w/ max wind <38 mph Organized convection >200 km, >24 hours
Horizontal Structure of tropical cyclones • Total diameter: about 600km • Lifetime: up to a week or more • Make up: many thunderstorms arranged in pinwheel formation • Three components: • 1. Central eye - clear skies, light winds (25 km diameter) • 2. Eye wall - strongest winds (can be 200 mph), max precip. (up to 2500 mm/day) • 3. Spiral rainbands • Cylonic inflow, anticyclonic outflow. Outflow creates cirrus shield that often obscures pinwheel structure
Vertical Structure: Heating, temperature, pressure and wind • Warm core - fueled by thermal energy - core warmer than outside at upper levels • Maximum rainfall occur in the region of eye wall • Minimum surface pressure occurs in the region of central eye • Maximum winds occur in the region of eye wall H L
Vertical Structure: Feedbacks Sea surface temperature Convergence-Convection (CISK): positive Surface flux-Convection (WISHE): positive Air-sea interaction: negative
The most common atmospheric circulation structure H L Radiation Convection Cooling or No Heating Heating Latent/Sensible Conduction H L Land/Ocean/Ice Feedback • Imbalance of heating • Imbalance of temperature • Imbalance of pressure • Wind
Hurricane Intensity Scale • Saffir-Simpson scale classifies hurricanes into five categories based on: • - central pressures (ended in 1990s) • - maximum sustained wind speeds (used now) Categories 3, 4, 5 are collectively called major hurricanes. They account for 21% of hurricane landfall in U.S., but cause 83% of the damage.
Hurricane names • Named alphabetically • 6 lists in rotation • When there is a hurricane that is too devastating, the name will retire and be replaced by a new name 2007 2008 2009 2010 2011 2012 Andrea Arthur Ana Alex Arlene Alberto Barry Bertha Bill Bonnie Bret Beryl Chantal Cristobal Claudette Colin Cindy Chris Dean Dolly Danny Danielle Don Debby Erin Edouard Erika Earl Emily Ernesto Felix Fay Fred Fiona Franklin Florence Gabrielle Gustav Grace Gaston Gert Gordon Humberto Hanna Henri Hermine Harvey Helene Ingrid Ike Ida Igor Irene Isaac Jerry Josephine Joaquin Julia Jose Joyce Karen Kyle Kate Karl Katia Kirk Lorenzo Laura Larry Lisa Lee Leslie Melissa Marco Mindy Matthew Maria Michael Noel Nana Nicholas Nicole Nate Nadine Olga Omar Odette Otto Ophelia Oscar Pablo Paloma Peter Paula Philippe Patty Rebekah Rene Rose Richard Rina Rafael Sebastien Sally Sam Shary Sean Sandy Tanya Teddy Teresa Tomas Tammy Tony Van Vicky Victor Virginie Vince Valerie Wendy Wilfred Wanda Walter Whitney William
Trends and variability in Hurricane Activity • Destructive hurricane seasons result in public awareness and general concern that hurricane activity is related to global warming. • There is little evidence for an increase trend in tropical cyclone activity. • The Atlantic Multidecadal Oscillation (AMO) is a 60yr oscillation in water temperatures and is a major factor in the increase in Atlantic hurricane activity.
Tropical cyclone Destruction and Fatalities • Destruction caused by: • Hurricane-scale winds (>74 mph) • Rainfall (10 in/day) • Storm surge (winds blowing coast-ward + lower atmosphere pressure) • Fine-scale Tornadoes • Destruction most intense on right side of cyclone (wind + storm speed)
Hurricane-spawned tornadoes • More than half of the landfall hurricanes produce at least one tornado • Hurricane Buelah (1967) produced 141 tornadoes • Most likely occur in the right-front quadrant • Generally less intense than those that occur in the great plains
Hurricane Forecasts and Advisories • The National Hurricane Center is responsible for predicting and tracking Atlantic and east Pacific hurricanes. • Data are gathered through satellite observations, surface observations, and aircraft using dropsondes (packaging containing temperature, pressure, and moisture sensors). • Statistical, dynamic, and hybrid computer models running on supercomputers assist in forecasting track position and storm intensity. • Future positions are given along six-hour trajectories with accuracy decreasing as lead time increases. By Tim Marchok of NOAA/GFDL
Summary • Tropical cyclone genesis: Western Pacific has the highest averaged number per year. 6 necessary conditions. 4 stages. • Tropical cyclone structure: 3 major components, rotation direction of inflow and outflow, location of maximum wind and rainfall, 3 feedbacks • Tropical cyclone intensity scale. Category 1: 74mph, category 5: 155mph • Hurricane names: alphabetically, 6 lists in rotation • Trends and variability in tropical cyclone activity • Tropical cyclone destruction: 4 reasons? Which side has the most intense destruction? • Tropical cyclone forecast: track and intensity Currently which skill is better?