Download
1 / 34
370 likes | 1.06k Views
Liquids. 11.3 – 11.6. Viscosity of Liquids . Viscosity - resistance of a liquid to flow - molecules slide over one another. •Viscosity depends on the strength of IMF: stronger IMF means higher viscosity. Viscosity decreases with an increase in temperature. (think syrup!)

E N D
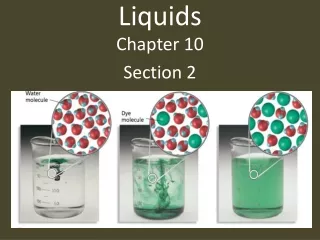
Liquids 11.3 – 11.6
Viscosity of Liquids • Viscosity - resistance of a liquid to flow - molecules slide over one another. •Viscosity depends on the strength of IMF: stronger IMF means higher viscosity. • Viscosity decreases with an increase in temperature. (think syrup!) • Higher temp means more energy to overcome IMFs
Surface Tension • Bulk molecules in the liquid are equally attracted to all of their neighbors. • Surface molecules are only attracted inward towards the bulk molecules. • Surface molecules are packed more closely than bulk molecules. • This causes the liquid to behave as if it had a “skin”.
Surface tension - amount of energy required to increase the surface area of a liquid by a unit amount.(like m2 or in2) • Stronger IMFs cause higher surface tension. • Higher temperature - lower surface tension
Cohesive forces - IMF that bind molecules to one another. • Adhesive forces - IMF that bind molecules to a surface (container).
water and MOST substances adhesive > cohesive mercury cohesive > adhesive
Capillary action • The rise of liquids up very narrow tubes. • The liquid climbs until adhesive / cohesive forces are balanced by gravity.
Phase Changes and Energy Sublimation: solid gas Hsub > 0 (endothermic) . Melting or fusion: solid liquid Hfus > 0 (endothermic) Vaporization: liquid gas Hvap > 0 (endothermic) Deposition(crystalization): gas solid Hdep < 0 (exothermic) Condensation: gas liquid Hcon < 0 (exothermic) Freezing: liquid solid Hfre < 0 (exothermic)
Harder with weak IMFs Easier with strong IMFs Exothermic Solid--------Liquid--------Gas Easier with weak IMFs Harder with strong IMFs Endothermic
Heating Curves • Plot of temperature change versus heat added is a heating curve. • During a phase change, temp. remains constant even though energy is being added (plateau on heating curve) • Added energy overcomes IMF rather than cause temperature change.
Heating Curve for water Notice the plateaus where temperature levels off even though energy is still being added. Notice that there are 5 different parts to the “curve”
To calculate the amount of heat absorbed/released from a heating curve: • Use q=mΔTcp for increasing/decreasing lines • Use q=mΔH for flat lines • Add q values for each line segment to find the total q for the process.
ENERGY CONVERSIONS Sample Problem #7 Calculate the energy required to convert 25.0 g of ice at -13°C to steam at 125°C. This problem needs 5 steps step 1 ice at -13°C to ice at 0°C (raising T to mp) q = (mass) (ΔT) (S.H.) = (25.0 g) (13°C) (2.09 J/g °C) = 680 J step 2 ice at 0°C to liquid water at 0°C (melting) q = (mass) (heat of fusion) = (25.0 g) (334 J/g) = 8350 J step 3 water at 0°C to water at 100°C (raising T to bp) q = (mass) (ΔT) (S.H.) = (25.0 g) (100°C) (4.184 J/g °C) = 10500 J step 4 water at 100°C to steam at 100°C (boiling) q = (mass) (heat of vaporization) = (25.0 g) (2260 J/g) = 56500 J step 5 steam at 100°C to steam at 125°C (raising to final T) q = (mass) (ΔT) (S.H.)= (25.0 g) (25°C) (1.84 J/g °C) = 1200 J final answer = 680 J + 8350 J + 10500 J + 56500 J + 1200 J = 77200 J
Critical temperature is the highest temperature at which a substance can exist as a liquid - above Tc molecules have too much energy to be a liquid • Critical pressure is the pressure required for liquefaction at this critical temperature. • The greater the IMF, the higher the critical temperature.
Vapor Pressure • Some molecules on the surface of a liquid have enough energy to escape the attraction of the bulk liquid and move into the gas phase.
As the number of molecules in the gas phase increases, some of the gas phase molecules strike the surface and return to the liquid. • After some time the pressure of the gas will be constant. • A dynamic equilibrium has been established • Vapor pressure is the pressure exerted when the vapor is in dynamic equilibrium with its liquid
Volatility • Liquids with lower IMFs tend to have high vapor pressures • Liquids that evaporate easily are said to be volatile. (have low IMF)
Vapor Pressure and Temperature • Increasing temperature will increase vapor pressure exponentially • Higher temps mean the molecules have more energy to overcome the IMFs that hold them in the liquid phase. • increasing temperature will increase evaporation and will produce more vapor molecules, so more pressure • increasing temperature will increase the pressure of any gas (or vapor) (Charles’ law)
Vapor Pressure and Boiling Point • Boiling occurs when the vapor pressure equals the pressure above the liquid • The normal BP is the temperature when the vapor pressure is equals standard pressure (1 atm)
Vapor Pressure and Boiling Point • Decreasing air pressure (going up in altitude) lowers the temperature at which a liquid will boil – food does not cook as fast (high altitude cooking directions on boxed foods)
Two ways to get a liquid to boil: (1) increase temperature (2) decrease pressure above liquid
Clausius-Clapeyron Equation (Relationship between vapor pressure and temperature) • more often written for a gas (or vapor) at 2 different P and T as:
Graphing 1/T versus ln P The slope of this line = - ΔHvap / R The slope can be used to determine ΔHvap ΔHvap = - (slope)(R) y = m x + b ln P 1 / T
Use of Clausius-Clapeyron Equation to find ΔH Ether has Pvap = 400 mm Hg at 17.9oC and a normal BP of 34.6oC. What is the heat of vaporization, Hvap , for ether in kJ/mol? P1= 400 mm Hg T1 =17.9oC = 290.9 K P2= 760 mm Hg T2 = 34.6oC =307.6 K * Normal BP is at standard pressure R = 8.3145 J/mol·K
Use of Clausius-Clapeyron Equation to find a pressure The vapor pressure of ethanol at 34.7oC is 100.0 mm Hg. The heat of vaporization is 38.6 kJ/mole. What is the vapor pressure of ethanol in mm Hg at 65.0oC? P1= 100.0 mm Hg T1 = 34.7oC = 307.7 K P2 = ?? T2 = 65.0oC = 338.0 K Hvap = 38.6 kJ/mol = 38600 J/mol R = 8.3145 J/mol·K Thus: lnP2 = 5.9577 P2 = e5.9577= 386.7 mm Hg
Phase Diagrams • plot of pressure vs. temperature summarizing all equilibria between phases. • Phase diagrams tell us which phase will exist at a given T and P Features of a phase diagram: Vapor-pressure curve: generally as T increases, Pvap increases. Critical point: critical temperature and pressure for the gas. Normal melting point: melting point at 1 atm (101 kPa) Normal boiling point: boiling point at 1 atm (101 kPa) Triple point: T and P at which all three phases are in equilibrium. Any T and P combination on a curve represent 2 phases Any T and P combination not on a curve represents a single phase.
Generic Phase Diagram Liquid Melting Freezing Solid Vaporization Critical point Triple point Sublimation Condensation Deposition Gas (vapor)
Notice that the solid-liquid line for water has a negative slope. This is because solid ice is less dense than liquid water. • What phase or phases are present • at any point on curve YX? • at any point on curve AD? • at any point on curve AB? • at point A or X? solid and vapor liquid and vapor solid and liquid solid, liquid and vapor
Looking at the water diagram on the left, what effect would each of the following have on a sample of water at any point on the AD curve. • increasing T at constant P • decreasing P at constant T? • decreasing T at constant P? • increasing P at constant T? turns into vapor turns into vapor turns into liquid then solid turns into liquid
Using the two diagrams above: a) points A and X are called b) point B is called c) point C is called d) point Y is called e) points D and Z are called triple point normal melting/freezing point normal boiling/condensing point normal sublimation/deposition point critical point
Good explanation of phase diagrams: http://www.chemguide.co.uk/physical/phaseeqia/phasediags.html