Download
1 / 17
170 likes | 359 Views
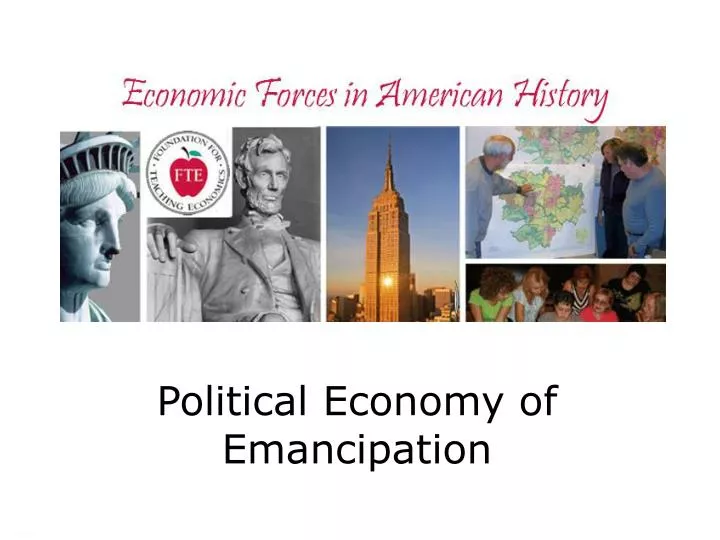
Political Economy of Emancipation. What was Slavery?. Legally: Property Morally: absence of freedom Unrestrained personal control of one group over another Denial of economic opportunity Denial of citizenship, basic rights Denial of cultural self-identification.

E N D
What was Slavery? • Legally: Property • Morally: absence of freedom • Unrestrained personal control of one group over another • Denial of economic opportunity • Denial of citizenship, basic rights • Denial of cultural self-identification
U.S Slavery in Perspective • U.S. imported 7% of the total 10 million slaves imported to the Western Hemisphere • Brazil 36%; Caribbean 40%; Spanish America 17% • Sugar drove the world slave trade • Tobacco drove the U.S. market for slaves in the 18th century • Cotton drove the U.S. market for slaves following the cotton gin – 1793 • U.S. Cotton output: 100,000 bales (1801) to 5,400,000 bales (1859).
Profitability of Slavery Calculating profitability- Revenues minus costs Unprofitable if value of children sufficiently negative or if maintenance exceeds the value of output Return on Capital = Profit/Capital Returns were consistently greater than 10% per annum and therefore profitable and economically viable. Future Profitability: the ratio of slave prices to rental rates was increasing on the eve of the Civil War – analogous to a Price/Earnings Ratio
Cotton • The key to Southern Agriculture and the continuation of slavery is cotton. • Unlike northern agriculture, which was dominated by small family farms, southern agriculture was dominated by a relatively small number of very large farms, growing cotton, and using slave labor.
Cotton • Cotton output (thousands of bales): • 1790 - 3 • 1800 - 73 • 1810 - 178 • 1820 - 335 • 1830 - 732 • 1840 - 1348 • 1850 - 2136 • 1860 - 3841
Farm size • Improved acres Mean Median • South 135.9 70.6 • alluvial 209.7 70.0 • North 64.5 49.3 • Ohio 72.2 64.8 • The key here is, there was very little difference between the median farm in the north and south, it was the presence of a few large plantations that make the difference.
Wealth and Land distribution • In the cotton south, there was a relative small number very large farms. • The most valuable 10% of farms in the south accounted for roughly 60% of total farm value, in the north the most valuable 10% of farms accounted for about 40% of total farm value.
Profitability of Slavery (cont.) Profitability of Slavery: Profitability depended on the owners’ ability to coercively extract greater revenues or lower costs from slavery relative to free market agriculture. More profitable on larger farms –economies of supervision in operating gangs – shorter hours but greater intensity than free labor
30-Year Amortization Costs of Emancipation in 1860 Source: Goldin, “The Economics of Emancipation,” in Atack and Passell, A New Economic View, p. 359.
Direct Costs of the Civil War • Total – North $3,366 million dollars - South $3,286 million dollars • Compensated emancipation less than half the cost of the war • 4 times the total G expenditures from 1789-1860 • Includes: G expenditures; undercounted labor costs of draft; human capital lost; and less risk premium of soldier pay. • 600,000 deaths, 500,000 casualties; 9% of male population between the ages of 15 and 39 • 1870 - ¼ of the Mississippi budget was spent on artificial limbs
Political Economy of Emancipation Northwest Ordinance (1787) - Slavery was banned above the Ohio River. Missouri Compromise (1820) Missouri-slave state Maine-free state Established “the Balance Rule” states admitted in pairs; guaranteed veto in the Senate AR (36); MI (37); FL, TX (45);IA, WI (46,48) Slavery outlawed, “hereby forever prohibited”, above 31’ 30” in the Louisiana Purchase Note the role of Congress in the territories… the Dred Scott decision would overturn this role!
Political Economy of Emancipation • Wilmot Proviso (1846)- No slavery in any territory acquired from Mexico –implementation would have made “balance” difficult • Compromise of 1850- • California admitted as a free state • New Mexico territory organized with no mention of slavery • Credible commitment to restore balance: KS/NB Act in the works • A new, more rigorous, fugitive slave law passed; and slave trade abolished in D.C.
Political Economy of Emancipation • The Kansas-Nebraska Act (1854): The Kansas and Nebraska territories would be organized under “popular sovereignty” - overturned latitude provision of the MO compromise • 1858 – Democrats sought to admit KS as a slave state -steeped in controversy, fraud and blood - Congress did not allow its admission Democrats did prevent passage of Homestead Act
Political Economy of Emancipation • Dred Scott Case (1857) - Court ruled: • Scott was not free • Free blacks are not citizens • Congress could not legislate slavery in the territories • KS/NE Act; Scott Decision and Democratic Push to Admit KS as a slave state led to the fall of the Whig party and the rise of the Republican Party • Republican constituents: Immigrants and Eastern Industrialists not willing to compromise on slavery