Download
1 / 36
360 likes | 504 Views
Marilyn Murphy, David Plavcan, William Shepard, Donna Suevo, Jeff Thomas, Karen Trozzo, Timothy Woods and David Yezuita West Chester University July 2002. Water Quality Assessment of the Brandywine Creek. Introduction. Water quality assessment of the Brandywine Creek drainage basin.

E N D
Marilyn Murphy, David Plavcan, William Shepard, Donna Suevo, Jeff Thomas, Karen Trozzo, Timothy Woods and David YezuitaWest Chester UniversityJuly 2002 Water Quality Assessment of the Brandywine Creek
Introduction • Water quality assessment of the Brandywine Creek drainage basin. • More emphasis on the East Branch. • Samples collected at various points including tributaries and downstream of point sources. • Impact of nutrients (nitrates and phosphates) and coliforms evaluated. • Recommendations and conclusions.
Purpose of Study • Assess water quality in the Brandywine Creek drainage basin. • Determine impacts from point and non-point sources of pollution. • Provide recommendations to minimize impacts.
History of Water Quality in Brandywine Creek • Agricultural use created problems with bacteria, nutrients and sedimentation. • Industrial use created issues with synthetic/volatile organic chemicals and metals. • Clean Water Act of 1972 enabled communities to improve water quality.
Current Water Quality Issues of the Brandywine Creek • Increased residential and commercial growth. • Increased storm water runoff, loss of pervious ground cover. • Increased demand for clean water.
Current Water Quality Issues of the Brandywine Creek • Watershed issues encompass many political borders. • Cooperation and coordination is a challenge.
Sources of Discharge • Two types of discharge: • Point Source • easily identifiable • indicated by pipes, drainage ditches, channels, tunnels, etc. • Non-Point Source • less obvious than point sources • surface run-off most common but also includes groundwater infiltration, erosion, and atmospheric deposition
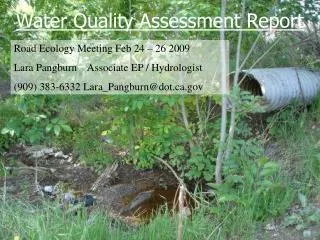
Point Sources to the East Branch • Downingtown Area Regional Wastewater Treatment Authority (DARWTA) • Taylor Run Sewage Treatment Plant (TRSTP) • Generic example: Photo obtained from Freefoto.com, accessed 7/13/02.
Potential Non-Point Sources to the East Branch • Run-off from agricultural fields, construction and industrial sites, public parks, and golf course. • Groundwater infiltration from faulty septic systems. • Erosion from mineral deposits (naturally occurring). • Others… Example of potential non-point source pollution from farm in rural Chester County.
Water Quality Concerns • Drinking water • Disinfection by products • Pathogens (e.g., Giardia and Cryptosporidium) • Terrorism • Stream water • Nutrients • Industrial discharges • Organic matter/DO level
Methods & MaterialsSample Collection • Field observations included: • types of vegetation • substrate • land use • Grab samples obtained using Horizontal Water Sampler. • Samples analyzed for nitrates, phosphates and total coliforms.
Methods & MaterialsDissolved Oxygen Concentrations • Field measurements included: • DO • pH levels • conductivity • DO meters measure the oxygen content in the water. • Low DO concentrations negatively affects aquatic life.
Methods & MaterialsConductivity & pH Levels • Conductivity meters • Salt/ion concentration • Indicator of total dissolved solids (TDS) • pH meters • Availability of hydrogen ions • Acceptable pH levels range from 5-9 with adverse biological effects occurring outside of this range
Methods & MaterialsNitrate & Phosphate Analysis • Nitrate and phosphate concentrations were determined by the standard curves resulting from serial dilutions of known concentrations. • Laboratory analysis included estimating concentration of nitrates, phosphates and total coliforms.
Methods & MaterialsNitrate & Phosphate Analysis • Analysis of the standards produced a linear equation: (y = mx + b). • Analysis of the water samples produced absorbance values that were converted to nitrate or phosphate concentrations by linear equation. • Ultraviolet spectrometers were used to measure absorbance values, which reflect concentration levels in a sample.
Methods & MaterialsTotal Coliform Analysis • Analysis of total coliforms used a membrane filtration technique. • Water samples were passed through 45-micron filters to collect possible bacteria. • Filters were placed in sterile petri dishes and incubated for 24 hours at 35°C at which time bacterial colonies were counted.
Dissolved Oxygen Results * * Current water quality standard concentration
Dissolved Oxygen 12.9 – 11.0 mg/L 10.9 – 9.0 mg/L 8.9 – 7.0 mg/L 6.9 – 5.0 mg/L Dissolved Oxygen Resultsby Sampling Location
Conductivity (microSeimens/cm) 600 - <700 599 - 500 499 - 400 399 - 300 299 – >200 Specific Conductance Resultsby Sampling Location
pH Results Acceptable range of pH: 5-9
pH 9.4 –9.0 8.9 – 8.5 8.4 – 8.0 7.9 – 7.5 7.4 – 7.0 pH Results by Sampling Location
Nitrate (NO3-2-N) Results Water quality criteria value (10 mg/L) * * * * * Downstream of WWTP effluent
Nitrate-N Concentrations 8.4 – 7.0 mg/L 6.9 – 5.5 mg/L 5.4 – 4.0 mg/L 3.9 – 2.5 mg/L 2.4 – 1.0 mg/L Nitrate (NO3-2-N) Resultsby Sampling Location
Nitrate Discussion • Downstream of point sources (WWTPs) typically have greater levels of NO3-2-N. • No samples exceed water quality criteria value (10 mg/L). • Current sample results fairly similar to historical median concentrations. • WWTPs are main entry point for nitrate in the drainage basin. • Decreased as distance from source increased.
Phosphate (PO4-3-P) Results * EPA recommended value (0.1 mg/L) * * * * * Downstream of WWTP effluent
Phosphate-P Concentrations 0.149 – 0.12 mg/L 0.119 – 0.09 mg/L 0.089 – 0.06 mg/L 0.059 – 0.03 mg/L 0.029 – 0.00 mg/L -0.009 – 0.03 mg/L Phosphate (PO4-3-P) Resultsby Sampling Location
Phosphate Historical Trends EPA recommended value (0.1 mg/L) ND ND ND = not detected
Phosphate Discussion • Downstream of point sources (WWTPs) have detected levels of PO4-3-P. • One sample result exceeds EPA’s recommended phosphate value (0.1 mg/L). • Sample results slightly less than historical median concentrations. • WWTPs are main entry point for phosphate in the drainage basin. • Monitoring of effluent and more effective treatment methods needed.
Total Coliform Discussion • Unhealthy bacteria levels prior to 1972 CWA. • Bacteria concentrations decreased from 1973 – 1999 due to improved treatment and decreased point source discharges. • Fecal coliform bacteria limits (PADEP): • 200 colonies/100 mL from May-September • 2000 colonies/100 mL for rest of year • Chlorination of water prior to discharge eliminates much of the coliforms.
Conclusions • Nitrate concentrations increased with addition of points sources but remained within the acceptable range. • Coliforms effectively removed during treatment process. • Phosphate concentrations increased with addition of points sources. • pH and DO values were within acceptable ranges.
Recommendations • Measures to reduce pollution: • Riparian corridors • Stream bank fencing • Proper fertilizer application • Farming practices • Phosphate removal • More effective or better applied treatment of phosphate • Addition of aluminum sulfate • Monitoring
Acknowledgements • Gary Kreamer (Delaware Aquatic Resource Education Center) • Francis Menton (City of Wilmington Water Department)