Download

1 / 26
260 likes | 374 Views
MODEL BUILDING IN REGRESSION MODELS. Model Building and Multicollinearity. Suppose we have five factors that we feel could linearly affect y. If all 5 are included we have: y = 0 + 1 x 1 + 2 x 2 + 3 x 3 + 4 x 4 + 5 x 5 +

E N D
MODEL BUILDING IN REGRESSION MODELS
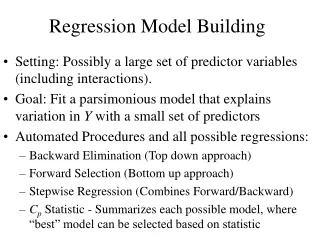
Model Building and Multicollinearity • Suppose we have five factors that we feel could linearly affect y. If all 5 are included we have: y = 0 + 1 x1 + 2 x2 + 3 x3 + 4 x4 + 5 x5 + • But while the p-value for the F-test (Significance F) might be small, one or more (if not all) of the p-values for the individual t-tests may be large. • Question: Which factors make up the “best” model? • This is called model building
Model Building • There many approaches to model building • Elimination of some (all) of the variables with high p-values is one approach • Forward stepwise regression “builds” the model by adding one variable at a time. • Modified F-tests can be used to test if the a certain subset of the variables should be included in the model.
Suppose this model has lowest p-value (< α) The Stepwise Regression Approach • y = 0 + 1 x1 + 2 x2 + 3 x3 + 4 x4 + 5 x5 + • Step 1: Run five simple linear regressions: • y = 0 + 1 x1 • y = 0 + 2 x2 • y = 0 + 3 x3 • y = 0 + 4 x4 • y = 0 + 5 x5 • Check the p-values for each – • Note for simple linear regression Significance F = p-value for the t-test.
Suppose lowest p-values (< α) Add X3 Stepwise Regression • Step 2: Run four 2-variable linear regressions: Check Significance F and p-values for: • y = 0 + 4 x4 + 1 x1 • y = 0 + 4 x4 + 2 x2 • y = 0 + 4 x4 + 3 x3 • y = 0 + 4 x4 + 5 x5
Stepwise Regression • Step 3: Run three 3-variable linear regressions: • y = 0 + 3 x3 + 4 x4 + 1 x1 • y = 0 + 3 x3 + 4 x4 + 2 x2 • y = 0 + 3 x3 + 4 x4 + 5 x5 • Suppose none of these models have all p-values < α -- STOP -- best model is the one with x3 and x4 only
Performing Tests With More Than One Variable • Remember the Range for X must be contiguous • Use CUT and INSERT CUT CELLSto arrange the X columns so that they are next to each other
Best Model • The best model is the three-variable model that includes x1, x4, and x5.
TESTING PARTS OF THE MODEL • Sometimes we wish to see whether to keep a set of variables “as a group” or eliminate them from the model. • Example: Model might include 3 dummy variables to account for how the independent variable is affected by a particular season (or quarter) of the year. • Will either keep all seasons or will keep none • The general approach is to assess how much “extra value” these additional variables will add to the model. • Approach is a Modified F-test
Approach: Compare Two Models –The Full Model and The Reduced Model • Suppose a model consists of p variables and we wish to consider whether or not to keep a set of p-q of those p variables in the model. • Two models • Full model – p variables • Reduced model – q variables • For notational convenience, assume the last p-q of the p variables are the ones that would be eliminated. • Sample of size n is taken
# variables considered for elimination Degrees of Freedom for the Error Term of the Full Model The Modified F-Test • Modified F-Test: H0: βq+1 = βq+2 = ..… = βp = 0 HA: At least one of these p-q β’s ≠ 0 • This is an F-test of the form: Reject H0 (Accept HA) if: F > Fα,p-q,n-p-1
The Modified F-Statistic • For this model, the F-statistic is defined by:
Example • A housing price model (Full model) is proposed for homes in Laguna Hills that takes into account p = 5 factors: • House size, Lot Size, Age, Whether or not there is a pool, # Bedrooms • A reduced model that takes into account only the first of these (q = 3) was discussed earlier. • Based on a sample of n = 38 sales, can we conclude that adding these p-q = 2 additional variables (Pool, # Bedrooms) is significant?
The Modified F-Test For This Example • Modified F-Test: H0: β4 = β5 = 0 HA: At least one of β4 and β5 ≠ 0 For α = .05, the test is Reject H0 (Accept HA) if: F > F.05,2,32 F.05,2,32 can be generated in Excel by FINV(.05,2,32) = 3.29.
SSEFull DFEFull MSEFull Full Model
SSEReduced Reduced Model
SSE from Output Reduced Worksheet =((G3-C13)/2)/D13 =FINV(.05,2,B13) The Partial F-Test
The Modified F-Statistic • For this model, the modified F-statistic is: • The critical value of F = F.05,2,32 = 3.29453087 • 21.43522834 > 3.29453087 There is enough evidence to conclude that including Pool and Bedrooms is significant.
Review • Stepwise regression helps determine a “best model” from a series of possible independent variables (x’s) • Approach – • Step 1 – Run one variable regressions • If there is a p-value < , keep the variable with lowest p-value as a variable in the model • Step 2 – Run 2-variable regressions • One of the two variables in each model is the one determined in Step 1 • Keep the one with the lowest p-values if both are < • Repeat with 3, 4, 5 variables, etc. until no model as has p-values < • Modified F-test for testing the significance of parts of the model • Compare F to Fα,p-q,DFE(Full), where F= ((SSEReduced – SSEFull)/(#terms removed))/MSEFull