Download
1 / 19
190 likes | 200 Views
Turbulence and wind speed profiles for simulating TMT AO performance. Tony Travouillon M. Schoeck, S. Els, R. Riddle, W. Skidmore, B. Ellerbroek, G. Herriot. S. Els. On the menu today. What and how are we measuring. The data available. How to read this data.

E N D
Turbulence and wind speed profiles for simulating TMT AO performance Tony Travouillon M. Schoeck, S. Els, R. Riddle, W. Skidmore, B. Ellerbroek, G. Herriot TMT.AOS.PRE.09.030.DRF01 S. Els
On the menu today • What and how are we measuring. • The data available. • How to read this data. • How we are so far using it for AO simulations. S. Els TMT.AOS.PRE.09.030.DRF01
Measuring turbulence with a MASS-DIMM A. Tokovinin TMT.AOS.PRE.09.030.DRF01
100 km Where did we make those measurements Tolar La Silla Las Campanas AURA ALMA Santiago Tolonchar Paranal Armazones
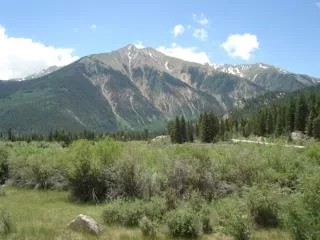
Armazones from the airThe little white speck on the summit is the site testing telescope.
San Pedro Mártir MASS/DIMM telescope
A special care given to cross-calibration and error management TMT.AOS.PRE.09.030.DRF01
Wind profiles • We use the NCEP/NCAR reanalysis data • Publicly available • Global grid (~250km resolution) • Data available every 6 hours • 16 layers from 761m to 25km • Data verified against balloon measurements • We also have ground data taken with SODARs and weather stations TMT.AOS.PRE.09.030.DRF01
Turbulence data available • Huge database • Between 150,000 and 285,000 profiles per site. • Will be made public in the future. TMT.AOS.PRE.09.030.DRF01
How can that much data be useful to AO simulations? • AO simulations that are CPU intensive may not run every individual profiles • The difficulty we are dealing with here is the following: There is no such a thing as an average or typical profile • This difficulty comes from more the statistical nature of turbulence and is an issue on all time scales • “An average profile does not have an average seeing” • TMT has looked at several options TMT.AOS.PRE.09.030.DRF01
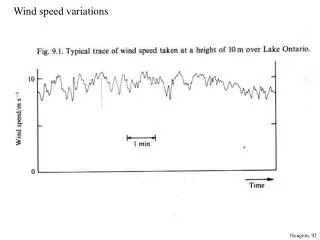
Short and long term variations TMT.AOS.PRE.09.030.DRF01
Median profiles • How do you select a median profile? • Median of each layer? • Selected around Median seeing? • Selected around median isoplanatic angle? • See Els et al. (2009) PASP for full details TMT.AOS.PRE.09.030.DRF01
Median profiles • A solution considered for TMT simulation: Averaging profiles around the median open loop wavefront variance due to the combined effects of fitting and servo-lag error: TMT.AOS.PRE.09.030.DRF01
A new approach…creating a standard night • Auto-regressive model • Generate time series that reproduce the 1st and 2nd order temporal statistics of the log(seeing) • Uses all data to recreate a time series of seeing of manageable size for simulations • Driven by temporal autocorrelation vector and Gaussian Random number generator TMT.AOS.PRE.09.030.DRF01
A new approach…creating a standard night • Keeps statistical characteristics of the site while reducing the number of profiles • Method to be presented at next OSA conference in September by Herriot et al. TMT.AOS.PRE.09.030.DRF01
Conclusion • TMT has collected a high quality and statistically representative sample of turbulence parameters at 5 sites. • Database to be made public. High potential for AO simulations. • Lessons learned: When possible, run the simulation on all data and then calculate the statistics on the results. • For time intensive simulations, it is important to realize that there is no such a thing as an average profile. Simulations give noticeably different results depending on selection criteria. TMT.AOS.PRE.09.030.DRF01