Download
1 / 90
930 likes | 1.45k Views
Cardiology - hemodynamics. William Harwey (1578-1657). Hemodymamics Discovery of blood circulation and heart function (published 1628) This theory was fully accepted after discovery of pulmonary capillaries (Marcello Malpighi - 1661). . Basic measurements on heart. Přetlaková komůrka.

E N D
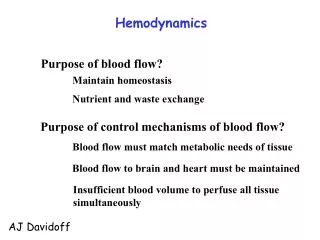
William Harwey (1578-1657) • Hemodymamics • Discovery of blood circulation and heart function (published 1628) • This theory was fully accepted after discovery of pulmonary capillaries (Marcello Malpighi - 1661).
Basic measurements on heart Přetlaková komůrka Adjustable resistance Arterial resistance Flow indicator Venous reservoir Intra-ventricular pres-sure (left ventricle) Flow indicator ventricle volumes Intra-ventricular pressure (right ventricle) Heart Central venous pressure
filling pressure intraventricular pressure ventricular volume
Identical stroke volume Bigger tension inside the wall smaller ejection fraction
isometric muscle force Muscle length Length of sarcomere
stimulation by sympaticus or catecholamines isovolumic maxima intraventricular pressure Heart insufficiency Enddiastolic filling Ventricular volume
isotonic maxima Intraventricular pressure Izotonic maxima Enddiastolic filling Ventricular volume
Intraventricular pressure isovolumic maxima Isovolumic contraction Isotonic maxima auxotonic contractions Diastolic filling Isotonic contr. Ventricular volume
Enddiastolic volume afterload Stroke volume preload Systolic residual volume Intraventricular pressure Systolic work of the heart Izovolumic maxima Izotonic maxima Diastolic filling Diastolic work the filling blood (made on the heart) Ventricular volume
Stroke volume Stroke volume Intraventricular pressure Izovolumic maxima Izotonic maxima Diastolicfilling Greater preload ... Ventricular volume …increases cardiac output.
Stroke volume Stroke volume Intraventricular pressure Izovolumic maxima Izotonic maxima Diastolic filling Smaller preload... Ventricular volume …decreases cardiac output.
Catecholamines Stroke volume Stroke volumje Intraventricular pressure Izovolumic maxima Greater isovolumicmaxima Catecholamines increase the stroke volume Izotonic maxima Diastolic filling …without increasing the preload ! Ventricular volume
Zvýšení „afterloadu“ Stroke Stroke volume volume Stroke volume Intraventricular pressure Izovolumic maxima Bigger „afterload“ doesn’t change the stroke v. Izotonic maxima Diastolic filling ...But increases the preload Ventricular volume
Zvýšení „afterloadu“ katecholaminy Syst. objem Systolický objem Intraventricular pressure Izovolumic maxima Catecholaminsensure… Increased izovolumicmaxima thatbigger „afterload“ will neither change SV Izotonicmaxima Diastolic filling ...Nor increase thepreload! Ventricular volume
Minute cardiac output 7 l/min 6 l/min 5 l/min 4 l/min 3 l/min 50 torr 100 torr 150 torr Arterial pressure 200 torr
insufficiency ..smaller stroke volume Stroke Stroke Increase in preload volume volume Stroke volume increased stroke volume Intraventricular pressure Decreased izovolumic maxima Izovolumic maxima Izotonic maxima Diastolic filing Ventricular volume
Lowering of “Starling curve” increased stroke volume smaller stroke volume Minute cardiac output insufficiency greater preload End-diastolic pressure
smaller stroke volume Stroke Stroke Stroke greater preload volume volume volume increased cardiac output greaterfrequency Intraventricular pressure insufficiency Decreased izovolumic maxima Izovolumic maxima Re-increased izovolumic maxima catecholamines Izotonic maxima Diastolic filling increased diastolic compliance Ventricular volume
catecholamines increaseddiastolic compliance re-increase of „Starling curve“ lower „Starling curve“ increased stroke volume minute cardiac output insufficiency bigger preload End-diastolic pressure
Minute cardiac output Frank-Starling law Heart is a pump whose volume of the output is governed by its influx (i.e. pressure on the influx) End-diastolic pressure
Symptoms of Cardiovascular Diseases Chest pain or discomfort Dyspnea (abnormally uncomfortable awareness of breathing) Palpitations (uncomfortable awareness of beating of the heart) Syncope Peripheral edema Claudication
Principles in hemodynamics evaluation • Measurement and evaluation of volume and pressure provide information about the cardiovascular system function. • The cardiovascular system transports volume (blood) between individual bodycompartments • Bloodpressureis necessary to maintain proper blood flow • to form pressure gradient between heart and the periphery • to overcome the peripheral resistance. • Ohm’s law • Q (flow) = P (pressure gradient) / R (resistance)
Principles in hemodynamics evaluation Blood volume and pressure influence heart andvessels anatomy • changes which are important for the function of cardiovascular system • heart muscle dilatation • heart muscle hypertrophy • Increase in vessel resistance (organ, systemic, temporary, permanent)
Stroke (systolic) volume (SV) • blood volume ejected from ventricle during systole
Stroke Volume venous tonus breathing Muscle pump Fluid volume Venous return (Preload) myocardium contractility ESV EDV • Depends on: preload, afterload, contractility • SV = EDV (enddiastolic volume) – ESV (endsystolic volume) SV Vessel resistance (Afterload)
Ejection fraction (EF) EF = SV / EDV SV – systolic volume EDV – endiastolic volume
Ejection fraction (EF) • Basic parameter for evaluation of the systolic function of the heart • Decreased: decreased contractility (CHD, heart failure), valvular diseases, • Increased: hypertrofic cardiomyopathy
Ejection fraction (EF) Normal values: 50–55 % and more increased e.g. due to sympathetic stimulation and other inotropic action 40 % and less in systolic dysfunction Measurement: most commonly by echocardiography, ev. isotope methods
EDV1 End of diastole 1
SV1 ESV1 EF1 = SV1/EDV1 End of systole 1
SV2 ESV2 EF2 = SV2/EDV2 EF2> EF1 End of systole 2
EDV2 End of diastole 2
SV3 ESV3 EF3 = SV3/EDV3 End of systole 3
SV1 ESV1 EF1 = SV1/EDV1 EF1> EF3 SV1 = SV3 End of systole 1
Calculate and comment EF • Left ventricle has at the end of the diastole volume of 145 mL. Cardiac output is 4,8 L/min. Heart rate is 90/min.
Calculate and comment EF • EDV = 145 ml • SV = ? • CO = 4800 mL/min • HR = 90/min • SV = CO / HR = 4800 / 90 = 53,3 mL • EF = 53,3 / 145 = 0,37 (37 %)
Calculate and comment EF • Cardiac output is nearly normal • Mild tachycardia • Increased preload • Decreased EF Decreased effectivness of the systole is compensated by the increase of preload and tachycardia
Cardiac output, cardiac index CO = HR × SV (HR = heart rate, SV = stroke volume) • Normal values: 4–7 L/min CI = CO/body surface • Normal values: 2.8 – 4.2 L/m2 Measurment: • Thermodilution (standard) – Swan-Ganz catheter • Fick Principle • Noninvasive methods (Echo with Doppler)
Thermodilution method • The applies indicator dilution principles using temperature change as the indicator • A known amount of solution at a known temperature is injected rapidly into the right atrial lumen of the catheter. • This cooler solution mixes with and cools the surrounding blood, and the temperature is measured downstream in the pulmonary artery by a thermistor embedded in the catheter. • The resultant change in temperature is then plotted on a time-temperature curve
Systolic Function of Heart Renin-Angiotensin-Aldisteron Sympatic n. venous tonus breathing Muscle pump Fluid volume Venous return (Preload) myocardium contractility ESV EDV Heart rate EF Sympatic n. SV Vessel resistance (afterload) Cardiac output
Blood Pressure • Measured in millimeters of mercury (or kPa), within the major arterial system of the body • Systolic pressure • maximum blood pressure during contraction of the ventricles • Diastolic pressure • minimum pressure recorded just prior to the next contraction
Blood Pressure • The blood pressure is usually taken with the patient seated using standard blood pressure cuff • Additional information may be gained by checking the patient in the lying and standing positions • Systolic blood pressure should not drop more than 10 mm Hg, and diastolic pressure should remain unchanged or rise slightly.
Systemic BP • systolic: heart function • diastolic: peripheral resistance • mean pressure • pressure amplitude • hypertension, hypotension
Interpretation of Blood Pressure Measurements inIndividuals 18 Years of Age and Older
Pressures in the heart Atria • Pressure practically depends on the pressure in the ventricles if the valves are intact • Pressure gradients (atrium –ventricle) • valves open, the pressure in the atrium and ventricle is equal in diastole • difference originates due to valve stenosis • the gradient reflects the tightness of stenosis