Download
1 / 7
70 likes | 98 Views
Preliminary findings suggest injection-related seismicity in Mat.4 area. Further research needed to examine velocity models, earthquake depths, and potential correlations with production data. Detailed comparisons with geologic, geochemical, and tracer data required.

E N D
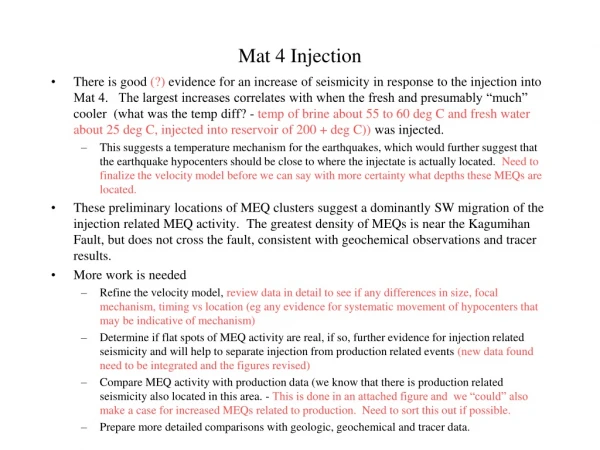
Mat 4 Injection • There is good (?) evidence for an increase of seismicity in response to the injection into Mat 4. The largest increases correlates with when the fresh and presumably “much” cooler (what was the temp diff? - temp of brine about 55 to 60 deg C and fresh water about 25 deg C, injected into reservoir of 200 + deg C)) was injected. • This suggests a temperature mechanism for the earthquakes, which would further suggest that the earthquake hypocenters should be close to where the injectate is actually located. Need to finalize the velocity model before we can say with more certainty what depths these MEQs are located. • These preliminary locations of MEQ clusters suggest a dominantly SW migration of the injection related MEQ activity. The greatest density of MEQs is near the Kagumihan Fault, but does not cross the fault, consistent with geochemical observations and tracer results. • More work is needed • Refine the velocity model, review data in detail to see if any differences in size, focal mechanism, timing vs location (eg any evidence for systematic movement of hypocenters that may be indicative of mechanism) • Determine if flat spots of MEQ activity are real, if so, further evidence for injection related seismicity and will help to separate injection from production related events (new data found need to be integrated and the figures revised) • Compare MEQ activity with production data (we know that there is production related seismicity also located in this area. - This is done in an attached figure and we “could” also make a case for increased MEQs related to production. Need to sort this out if possible. • Prepare more detailed comparisons with geologic, geochemical and tracer data.
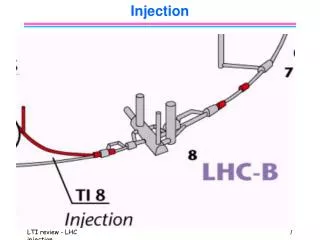
Mat 4 Inj Site X’s LBL locations, solid circles PGI locations (note velocity models are not the same, x,y locations will not be affected much). Approx. location of in-field injection site is shown. Area circled in green shows the MEQ considered for the comparison with injection into Mat 4.
Est. Back Ground MEQ Levels Shows seismicity in the cluster of events located near Mat 4 injection (refer to map). Back ground seismicity is illustrated with the red dashed line and is about 2 to 3 events/week. Largest increases in seismicity correspond with the injection of the fresh water with seismicity rates increasing to about 7 to 9 /week. During injection of the higher temperature brine the seismicity was closer to the background levels. We need to focus some more attention on areas where no events are observed to make sure this was really the case (these areas are circled). In two cases a period of week or more with no events observed corresponded with times of no injection (very good evidence for injection related seisimicity is in fact no events occurred during those periods.
Est. Back Ground MEQ Levels Show comparison of steam production rates from production area in vicinity of Mat 4 injection site and cumulative MEQ activity recorded with the detailed array. This figure illustrates that we could also make a case for a correlation of MEQ activity with changes of steam production rates. Need to review in more detail the MEQ activity as recorded by the PGI permanent array.
Sensitivity of the Array improved, March 2001, and 2 stations added May 2001 J. Cullen tunes network New new stations added, network improved Shows historical MEQ activity within the box 123.6280115,13.4625137; 123.6280115, 13.4778803; 123.6086178, 13.4625137; 123.6086178, 13.4778803. Also shown on the TMF monthly production for the area. The period where the injection experiment occurred is circled. Note that the apparent increase of seismicity in March 2001 corresponds with an improvement in the network and when two new stations were added to the network in May 2001. A portion of this increased seismicity in March 2001 is definitely related to the increased sensitivity of the network. This is evidenced by similar relative increases in the seismicity observed in other parts of the field during the period (next figure) and is typically observed when changes have been made to the network, see notes on the slide above.
NW of Tiwi Fault Figure TM1. Top map shows the MEQ activity recorded in the period July 1987 to December 2001. The MEQs can be subdivided to into 3 areas. These are located NW of Tiwi Fault, Takla and HB injection areas. The bottom figure shows the cumulative MEQ activity in each of these areas. This shows that the 3 areas have had distinctly different rates of MEQ activity until about 1993. After that the Takla and HB injection areas had similar rates while the area NW of the Tiwi fault still had relatively higher rates until about 1996. The sudden increase of MEQ activity in mid 2001 is due in part to increased sensitivity of the array (maintenance and addition of 2 new stations). The relative higher increase NW of the Tiwi, where the major production is located and the MAT 4 injection experiment occurred, indicates an increase in seismicty in this area is also likely to have resulted from the changes in production and the Mat 4 injection REVISED 5/24/02 Takla Fault HB Injection
The velocity model labled here as LBL model is an approximate of the previous model that we were using. For your info the current model that we think is closer to reality is the 11-26-01 model (but we should discuss). This more closely matches Romero’s result and gives more reasonable depths. The Vp/Vs we have been using is constant at 1.75