Download
1 / 35
350 likes | 460 Views
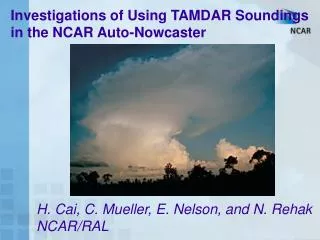
NCAR Auto-Nowcaster. Convective Weather Group NCAR/RAL. Why We Need ANC ?. The Auto-nowcaster System is unique in its ability to provide nowcasts of storm initiation by…. Detection and extrapolation of surface convergence boundaries …. ….that trigger

E N D
NCAR Auto-Nowcaster Convective Weather Group NCAR/RAL
The Auto-nowcaster System is unique in its ability to providenowcasts of storm initiationby….. Detection and extrapolation of surface convergence boundaries …. ….that trigger thunderstorm initiation and impact storm evolution.
Initiation nowcasts extrapolation nowcasts Example of Auto-Nowcaster Initiation Forecast 1 hour forecast Verification
Where has the Auto-nowcaster been demonstrated ? • Weather Forecast Office Washington DC • Sydney Australia Forecast Office • U. S. Army White Sands Missile Range • Central U. S. for the FAA • Process of being transferred to: • Bureau Meteorology Beijing China • U.S National Weather Service – Dallas Weather • Forecast Office • AWIPS
Auto-Nowcaster atFt. Worth WFO AREA WEATHER UPDATE NATIONAL WEATHER SERVICE FORT WORTH TX 310 PM CDT SUN APR 10 2005 > WARNING DECISION UPDATE FOR NORTH TEXAS MESOANALYSIS PROGRAMS SHOW 1000-1500 J/KG CAPE ALONG AND JUST AHEAD OF DRYLINE. THUS...CU/DEVELOPING STORMS ALONG/E OF DRYLINE SHOULD CONTINUE TO INTENSIFY. STORM INITIATION TOOL ALSO SUGGESTS HIGH POSSIBILITY OF DEVELOPMENT FARTHER SW...OVER CORYELL/LAMPASAS COUNTY AREA. DEEP-LAYER SHEAR MORE THAN SUFFICIENT FOR ORGANIZED STORMS AND AT LEAST MID-LEVEL MESOS. AS STORMS EVOLVE INTO THE EVENING...A MORE LINEAR MODE IS EXPECTED.
Flow Chart for the Auto-Nowcaster System Data Sets Radar WSR-88D Satellite Mesonet Profiler Sounding Numerical Model Lightning Predictor Fields Fuzzy Logic Algorithm - Membership functions - weights - Combined likelihood field Forecaster Input Analysis Algorithms Final Prediction
Flow Chart for the Auto-Nowcaster System Data Sets Radar WSR-88D Satellite Mesonet Profiler Sounding Numerical Model Lightning Predictor Fields Fuzzy Logic Algorithm - Membership functions - weights - Combined likelihood field Forecaster Input Analysis Algorithms Final Prediction
Membership Function .5 Yes Convergence line Likelihood .5 Likelihood Lifting Zone No 0 Lifting Zone Example of fuzzy logic Predictor Field 1
.1 .2 .3 Membership Function .2 .1 Convergence Likelihood Likelihood Convergence Predictor Field 2
-.5 .4 Likelihood -.5 Predictor Field 3 Membership Function Cumulus clouds 1 .8 .4 Likelihood -.5 -1 Cumulus cloud type
Likelihood 1 Likelihood 3 Likelihood2 Weight 1 Weight 2 Weight 3 Σ Final combined likelihood of initiation
Environmental conditions (RUC) Frontal likelihood Layered stability CAPE (max between 900 and 700 mb) Mean 875 to 725 mb Relative Humidity Boundary-layer Convergence LI (based on METARS) Vertical velocity along boundary (maxW) Boundary-relative steering flow New storm development along boundary Clouds Clear or Cumulus Vertical develop as observed by drop in IR temps Predictor Fields used for Combined Likelihood of Initiation Blue Regions - Little chance of storm development Green Regions - Moderate likelihood Red Regions - Areas of forecast initiation
60 Minute Initation (rules with satellite data) Wt: 0.10 Range: 0 to 0.10 Wt: 0.17 Range: -0.085 to 0.17 Wt: 0.20 Range: -0.20 to 0.02 Wt: 0.17 Range: -0.17 to 0.17 Wt: 0.08 Range: -0.02 to 0.08 Wt: 0.16 Range: -0.08 to 0.16
60 Minute Initation (rules with satellite data) Cont. Wt: 0.20 Range: -0.2 to 0.2 Wt: 0.20 Range: 0 to 0.20 Wt: 0.20 Range: 0 to 0.20 Wt: 0.15 Range: 0 to 0.15 Wt: 0.25 Range: 0 to 0.25
60 Minute Initation (rules with satellite data) Cont. Boundary Collision: Wt: 0.12 Range: 0 to 0.12 Sat_Clear: Wt: 0.40 Range: -0.40 to 0 Lake: Wt: 0.10 Range: -0.10 to 0 Initiation Levels: 0.70 => Init 1 0.90 => Init 2 1.20 => Init 3
60 Minute Initation (rules without satellite data) Wt: 0.10 Range: 0 to 0.10 Wt: 0.19 Range: -0.095 to 0.19 Wt: 0.20 Range: -0.20 to 0.02 Wt: 0.19 Range: -0.19 to 0.19 Wt: 0.08 Range: -0.02 to 0.08 Wt: 0.18 Range: -0.09 to 0.18
60 Minute Initation (rules without satellite data) Cont. Wt: 0.21 Range: -0.21 to 0.21 Wt: 0.21 Range: 0 to 0.21 Wt: 0.30 Range: 0 to 0.30
60 Minute Initation (rules without satellite data) Cont. Boundary Collision: Wt: 0.14 Range: 0 to 0.14 Sat_Clear: Wt: 0.40 Range: -0.40 to 0 Lake: Wt: 0.10 Range: -0.10 to 0 Initiation Levels: 0.70 => 25 dBZ 0.90 => 30 dBZ 1.20 => 32 dBZ
60 Minute Growth and Decay Wt: 0.30 Range: -0.3 to 0.3 Wt: 0.15 Range: -0.0375 to 0.15 Wt: 0.20 Range: -0.20 to 0.20 Growth/Decay Levels: < -0.75 => decay 6km -0.75 to -0.55 => decay 4km -0.55 to -0.35 => decay 2km -0.35 to 0.20 => steady 0.20 to 0.50 => grow 2km 0.50 to 70 => grow 4km >0.70 => grow 6km Lake: Wt: 0.20 Range: -0.20 to 0 Wt: 0.21 Range: -0.21 to 0.21
Predictor Fields Cumulus development Boundary characteristics Satellite Cloud Typing B-L characteristics Storm motion and trends Large-ScaleEnvironment
Predictor Fields Cumulus development Boundary characteristics Satellite Cloud Typing B-L characteristics Storm motion and trends Large-ScaleEnvironment
Why do we need a forecaster in the loop?? • Forecasters see the larger picture • Conceptual Models • Ignore bad data points • Understand limitations of NWP and observations
FAA RCWF Domain June 12, 2003 Forecaster Entered Boundary
Draw Tool Entering a convergence boundary in real time is as simple as this demonstration!
Ft. Worth WFO April 5, 2005 Forecast Verification
Evaluation of Initiation Cases - 2004 • Forecaster on duty • Convection within ANC domain that increased (based on area coverage) >20% in an hour. • Covered an area of 3,000 km2 (Valid Time).
Initiation/Growth Cases 60 min Time Interval • 34 Case Days (Ranging from 18 to 210 min – not always consecutive) • Divided into 3 categories: • Initiation along line (13) • Initiation in a region (6) • Primarily Growth (15) Initiation along line Initiation in region Growth
Bias vs. POD for ALL Initiation/Growth Cases Persistence Extrapolation ANC Forecast Growth/Decay Initiation level 2 Initiation level 1 Bias POD
Different types of initiation Persistence Extrapolation ANC Forecast Growth/Decay Initiation level 2 Initiation level 1 Red : All Cases Yellow : Initiation - line Cyan : Initiation - region Orange : Growth • Forecasts for growth show the most skill • Initiation of linear storm systems show most improvement over extrapolation Bias All Initiation - Line Growth Initiation- Region POD
END THANK YOU !