Download
1 / 20
210 likes | 385 Views
Satellite Rainfall Estimation. Robert J. Kuligowski NOAA/NESDIS/STAR 3 October 2011 Workshop on Regional Flash Flood Guidance System—South America Santiago de Chile, Chile. Outline. Motivation: Why Satellite? Satellite Rainfall Estimation Theory The NOAA/NESDIS Hydro-Estimator (H-E)

E N D
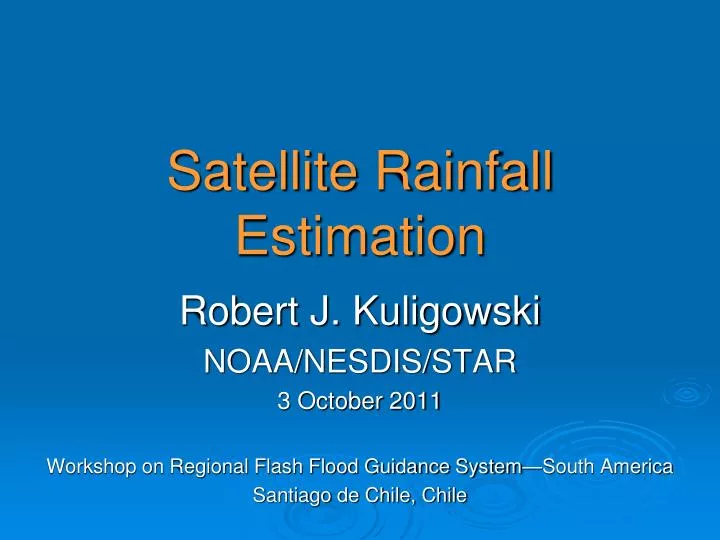
Satellite Rainfall Estimation Robert J. Kuligowski NOAA/NESDIS/STAR 3 October 2011 Workshop on Regional Flash Flood Guidance System—South America Santiago de Chile, Chile
Outline • Motivation: Why Satellite? • Satellite Rainfall Estimation Theory • The NOAA/NESDIS Hydro-Estimator (H-E) • Summary
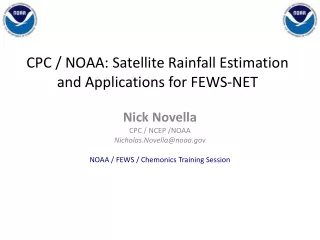
Motivation: Why Satellite? • Spatial Coverage • Covers land areas away from gauges and/or radar • Over-water coverage for incoming storms • Spatially uniform coverage at high spatial (3-5 km) and temporal (15 min) resolution • Latency • Potential data latency of less than half an hour • This makes satellite rainfall estimates a critical input to FFG • (Caveat) • Not as accurate as gauges, but quite good for convective rainfall
Satellite Rainfall Estimation Theory • Basic assumptions: • Cloud-top brightness temperature (Tb) cloud-top height (colder clouds have higher tops) • Cloud-top height strength of convective updraft (higher-topped clouds have stronger updrafts) • Strength of convective updraft rainfall rate (stronger upward moisture transport produces heavier rain) • In essence: • Colder clouds are associated with heavier rain • Warmer clouds are associated with light or no rain
Relationship of IR Signal to Rain Rate Tb=200 K Tb=212 K Tb=224 K Tb=230 K 250 200 290 T (K)
Satellite Rainfall Estimation Theory • Reasonable assumption for convective clouds (i.e., warm season showers / thunderstorms) • Poor assumption for • Stratiform clouds (i.e., cool-season long-duration rainfall) • Clouds are warm, but can produce significant rainfall) • Cirrus clouds (i.e., high, thin, wispy clouds) • Cold but do not produce any rain)
Exceptions... Cirrus Tb=205 K Cumulonimbus Tb=200 K Nimbostratus Tb=240 K 200 250 290 T (K)
Outline Motivation: Why Satellite? Satellite Rainfall Estimation Theory The NOAA/NESDIS Hydro-Estimator (H-E) Summary
Hydro-Estimator (H-E) Description • Operational at NOAA/NESDIS since August 2002 • Produced in real time for the entire globe between 60°N and 60°S using • GOES-11/13 (Western Hemisphere) • MTSAT-1 (Western Pacific) • METEOSAT-9 (Europe and Africa) • METEOSAT-7 (Central Asia) • Information, real-time images, and data at http://www.star.nesdis.noaa.gov/smcd/emb/ff/HydroEst.php
Hourly rainfall estimates for 0000-2300 UTC 4 June 2009 HE Example
H-E Description • Uses IR window Tb (10.7 µm) to determine raining areas and rain rates • Assigns rain only to regions where T10.7 is below local average (cloud top is higher above surrounding clouds); i.e., active precipitating cores
Tb < Tb Rain Tb ≥ Tb No Rain Tb < Tb Rain Tb ≥ Tb No Rain 200 250 290 T (K) Illustration of the HE Rain-No Rain Differentiation
H-E Description • Uses IR window Tb (10.7 µm) to determine raining areas and rain rates • Rain rates are a function of both T10.7 and its value relative to the local average— enhances rain rates in precipitating cores “Convective Core” rainfall “Non-core” rainfall PW (mm) PW (mm)
H-E Adjustments • Precipitable water (PW) from numerical models to enhance rainfall in regions of high moisture availability PW (mm) For a given Tb, rain rate increases as PW increases
H-E Adjustments • Relative humidity (RH) from numerical weather models reduces precipitation in arid regions Lower RHbigger reduction in rain rate
H-E Adjustments • Convective Equilibrium Level adjustment based on numerical weather model data Instability (LI=-5 K; CAPE = 860 J/kg) BUT convective equilibrium level of 293 hPa = 231 K 2 mm/h rainfall rate!
H-E Continued • Wind fields and digital topography for orographic effects where wind blows: • up slope (moistening / enhancement of rain) • down slope (drying / reduction of rain)
Summary • Satellites provide spatially uniform coverage and low data latency for rainfall rate estimation—critical features for supporting FFG. • The NOAA/NESDIS Hydro-Estimator provides real-time global coverage between 60°S and 60°N. • The estimates assume a relationship between cloud-top temperature and rainfall rate • Work best for convective rainfall… • …not as well for cool-season rain and snow, but gauges can be used to “fine-tune” the algorithm.
Questions?More information athttp://www.star.nesdis.noaa.gov/smcd/emb/ff/HydroEst.phpor e-mail Bob.Kuligowski@noaa.gov