Download
1 / 88
890 likes | 1.02k Views
Analysis and Impact of Leverage. Chapter 15. Goal of a firm.

E N D
Analysis and Impact of Leverage Chapter 15
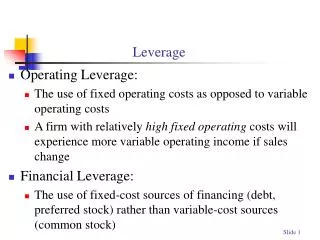
Goal of a firm • Managers' objective is to maximize stockholders' wealth--maximize the price of the firm's stock. We noted in an earlier chapter that the capital structure that produces the lowest WACC (risk) is also the one that maximizes share price.
Risk • Variability of the expected net income (EPS)
Risk • Variability of revenues from expected • Two types of Risk: Business Risk & Financial Risk
Risk • Variability of revenues from expected • Two types of Risk: Business Risk & Financial Risk • Revenue • -Variable Cost • Contribution margin • -Fixed cost • =EBIT/operating profits • -Interest • =NI
Risk • Variability of revenues from expected • Two types of Risk: Business Risk & Financial Risk • Business Risk • Risk Due to Operations
Risk • Variability of revenues from expected • Two types of Risk: Business Risk & Financial Risk • Business Risk • Risk Due to Operations • Measured by variability of EBIT (earnings before interest and taxes)
Risk • Variability of revenues from expected • Two types of Risk: Business Risk & Financial Risk • Business Risk • Risk Due to Operations • Measured by variability of EBIT (earnings before interest and taxes) • Coefficient of Variation of EBIT Standard Deviation of EBIT Expected EBIT =
Risk • Variability of revenues from expected • Two types of Risk: Business Risk & Financial Risk • Financial Risk • Risk due to raising money with fixed income securities
Business Risk • Major determinants of business risk • 1. Demand Variability • 2. Sales Price Variability • 3. Input Price variability. • 4. Inability to adjust output prices for a change in input prices-a utility can transfer costs more easily • 5. Operating Leverage--the extent to which costs are 'fixed' (the ratio of fixed cost to total cost). • Business risk not only varies from industry to industry, it varies among firms in a given industry. • Business risk of a firm can change over time.
Risk • Financial Risk • Risk due to raising money with fixed income securities • Financial risk is high with high levels of debt financing
Risk • Financial Risk • Risk due to raising money with fixed income securities • Financial risk is high with high levels of debt financing • Financial leverage - the use of fixed income securities to finance a portion of assets
Risk • Financial Risk • Risk due to raising money with fixed income securities • Financial risk is high with high levels of debt financing • Financial leverage - the use of fixed income securities to finance a portion of assets • Example • Firm A is an all equity firm -- it has no financial leverage
Risk • Financial Risk • Risk due to raising money with fixed income securities • Financial risk is high with high levels of debt financing • Financial leverage - the use of fixed income securities to finance a portion of assets • Example • Firm A is an all equity firm -- it has no financial leverage • Firm B is financed by 50% debt and 50% equity -- it uses financial leverage
Risk • Notes: • 1. Business risk is largely determined by technology and by industry/market conditions, although management decisions, to some extent, do matter. • 2. Financial risk is largely management determined. • 3. If business risk is high, financial risk (leverage) should be restrained.
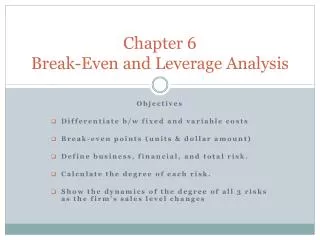
Break-even Analysis • The point of sales where operating profits are zero. The point where revenues barely cover all costs. • Steps to Solution • Determine the quantity of output which results in an EBIT = $0
Break-even Analysis • Steps to Solution • Determine the quantity of output which results in an EBIT = $0 • Shows output necessary to cover operating (not financial) costs
Break-even Analysis • Steps to Solution • Determine the quantity of output which results in an EBIT = $0 • Shows output necessary to cover operating (not financial) costs • Calculate EBIT at various output levels
Break-even Analysis • Steps to Solution • Determine the quantity of output which results in an EBIT = $0 • Shows output necessary to cover operating (not financial) costs • Calculate EBIT at various output levels • Applications • Capital Expenditure Analysis
Break-even Analysis • Steps to Solution • Determine the quantity of output which results in an EBIT = $0 • Shows output necessary to cover operating (not financial) costs • Calculate EBIT at various output levels • Applications • Capital Expenditure Analysis • Determining Prices • Evaluating Fixed vs. Variable Costs
Break-even Analysis • Assumptions • Fixed costs remain constant as quantity changes Fixed Costs Includes: Salaries, Depreciation, Rent
Break-even Analysis • Assumptions • Fixed costs remain constant as quantity changes Fixed Costs Includes: Salaries, Depreciation, Rent • Variable costs vary as quantity of output changes: they are constant per unit of output Variable Costs Includes: Materials, Labor, Commissions • Drop Semivariable costs
Break-even Analysis • Assumptions • Fixed costs remain constant as quantity changes • Variable costs vary as quantity of output changes: they are constant per unit of output Costs $ Variable Costs Fixed Costs Quantity Sold
Break-even Analysis • Assumptions • Fixed costs remain constant as quantity changes Fixed Costs Includes: Salaries, Depreciation, Rent • Variable costs vary as quantity of output changes: they are constant per unit of output Variable Costs Includes: Materials, Labor, Commissions • Revenues are quantity sold times price per unit
Break-even Analysis • Calculation of Break-even Quantity EBIT = Sales – Variable Costs - Fixed Costs Find Quantity which results in EBIT = $0
Break-even Analysis • Calculation of Break-even Quantity • Trial and Error Method • Choose arbitrary output level • Calculate EBIT • If EBIT < 0, choose a larger output level • If EBIT > 0, choose a lower output level • Continue until find a level of output which results in EBIT = $0
Break-even Analysis • Calculation of Break-even Quantity Algebraic Analysis F P – V QB = Where: QB = Break-even Quantity P = Price per Unit F = Total Fixed Costs V = Variable Costs per Unit
Break-even Analysis • Calculation of Break-even Quantity Example: F P – V QB = Fixed Costs = $1,000,000 per year Price = $800/unit Variable Costs = $400/unit
Break-even Analysis • Calculation of Break-even Quantity Example: F P – V QB = Fixed Costs = $1,000,000 per year Price = $800/unit Variable Costs = $400/unit $1,000,000 $800 – $400 QB =
Break-even Analysis • Calculation of Break-even Quantity Example: F P – V QB = Fixed Costs = $1,000,000 per year Price = $800/unit Variable Costs = $400/unit $1,000,000 $800 – $400 QB = = 2,500 Units
Break-even Analysis • Calculation of Break-even Sales Level (S*) To Find S* for a single product use Break-even Quantity (QB): S* = QB x P
Break-even Analysis • Calculation of Break-even Sales Level (S*) To Find S* for a single product use Break-even Quantity (QB): S* = QB x P S* = 2,500 units x $800
Break-even Analysis • Calculation of Break-even Sales Level (S*) To Find S* for a single product use Break-even Quantity (QB): S* = QB x P S* = 2,500 units x $800 = $2,000,000
Break-even Analysis • Calculation of Break-even Sales Level (S*) • May want to Calculate the Break-even Sales Level (S*) for the entire firm with many products
Break-even Analysis • Calculation of Break-even Sales Level (S*) • May want to Calculate the Break-even Sales Level (S*) for the entire firm with many products • Calculate from Income Statement data at a particular Sales Level
Break-even Analysis • Calculation of Break-even Sales Level (S*) • May want to Calculate the Break-even Sales Level (S*) for the entire firm with many products • Calculate for Income Statement at one Sales Level F 1 - VC S* = S S = Dollar Level of Sales VC = Total Dollar Variable Costs
Break-even Analysis • Calculation of Break-even Sales Level (S*) • May want to Calculate the Break-even Sales Level (S*) for the entire firm with many products • Calculate for Income Statement at one Sales Level F 1 - VC S* = S Example: S = Dollar Level of Sales = $3,000,000 VC = Total Dollar Variable Costs = $1,500,000 $1,000,000 1 – $1,500,000 S* = $3,000,000
Break-even Analysis • Calculation of Break-even Sales Level (S*) • May want to Calculate the Break-even Sales Level (S*) for the entire firm with many products • Calculate for Income Statement at one Sales Level F 1 - VC S* = S Example: S = Dollar Level of Sales = $3,000,000 VC = Total Dollar Variable Costs = $1,500,000 $1,000,000 1 – $1,500,000 S* = = $2,000,000 $3,000,000
Break-even Analysis • Graphical Analysis of Break-even Point Sales & Costs $ Fixed Costs $1,000,000 Quantity of Units
Break-even Analysis • Graphical Analysis of Break-even Point Sales & Costs $ Variable Costs Fixed Costs $1,000,000 Quantity of Units
Break-even Analysis • Graphical Analysis of Break-even Point Sales & Costs $ Total Costs Variable Costs Fixed Costs $1,000,000 Quantity of Units
Break-even Analysis • Graphical Analysis of Break-even Point Sales & Costs $ Sales Total Costs Variable Costs Fixed Costs $1,000,000 Quantity of Units
Break-even Analysis • Graphical Analysis of Break-even Point Sales & Costs $ Sales Total Costs Variable Costs $2,000,000 Fixed Costs $1,000,000 QB = 2,500 Quantity of Units
Break-even Analysis • Limitations: • The sales-volume-cost-profit relationship is assumed to be linear—it may not be. In the real world It is not, except for a small range of sales. • Cost-price structure of the firm is assumed to remains constant. It generally does not. • Sales price per unit is assumed to be constant regardless of the output. This is not the case in the real world—you have to ? Price if you want to sell more.
Operating Leverage • Degree of Operating Leverage • With FIXED operating costs, there will be operating leverage • DOL measures the sensitivity of EBIT to changes in sales. DOL of a company is different at different levels of sales. • High DOL implies that a relatively small change in sales will result in large change in the operating income (EBIT)
Operating Leverage • Degree of Operating Leverage • Operating Leverage is responsiveness of a firm’s EBIT to fluctuations in Sales
Operating Leverage • Degree of Operating Leverage • Operating Leverage is responsiveness of a firm’s EBIT to fluctuations in Sales • Degree of Operating Leverage (DOL) • Measurement of Operating Leverage • For a unique level of sales, DOL changes as sales change.
Operating Leverage • Degree of Operating Leverage • Operating Leverage is responsiveness of a firm’s EBIT to fluctuations in Sales • Degree of Operating Leverage (DOL) • Measurement of Operating Leverage • For a unique level of sales, DOL changes as sales change. % Change in EBIT % Change in Sales DOLS = Unique Level of Sales
Operating Leverage • Measurement of DOL • Calculation using per unit information: Q(P – V) Q(P – V) – F DOLS =
Operating Leverage • Measurement of DOL • Calculation using per unit information: Q(P – V) Q(P – V) – F DOLS = Example: Q = 3,750 units Price = $800 per unit Variable costs = $400 per unit Fixed Costs = $1,000,000 per year.