Download
1 / 55
550 likes | 719 Views
Giovanni for Air Quality: Recent development. G. Leptoukh NASA Goddard Space Flight Center. With a few mouse clicks, easily obtain information on the atmosphere, ocean and land around the world. No need to learn data formats to retrieve &process data.

E N D
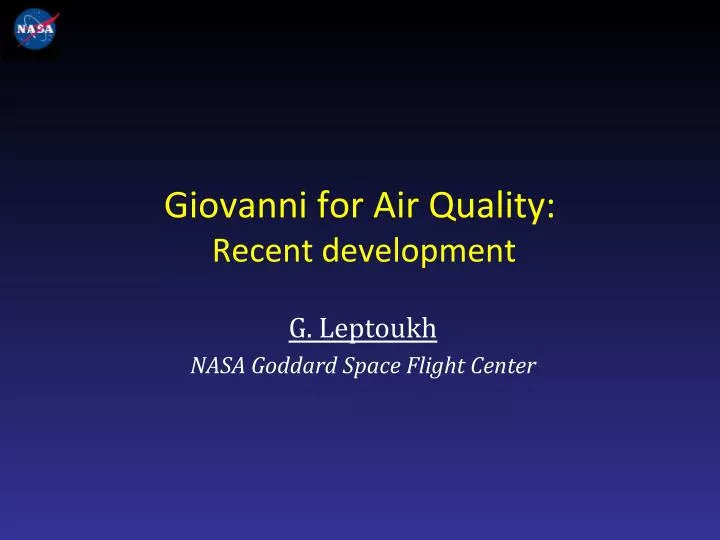
Giovanni for Air Quality: Recent development G. Leptoukh NASA Goddard Space Flight Center
With a few mouse clicks, easily obtain information on the atmosphere, ocean and land around the world. • No need to learn data formats to retrieve &process data. • Try various parameter combinations measured by different instruments. • All the statistical analysis is done via a regular web browser. • http://giovanni.gsfc.nasa.gov/ • Caution: Giovanni is a rapidly evolving data exploration tool! GoddardInteractiveOnlineVisualizationANdaNalysisInfrastructure(Giovanni)
Exploration Initial Analysis Use the best data for the final analysis Derive conclusions Write the paper Submit the paper Giovanni Allows Scientists to Concentrate on the Science The Old Way: The Giovanni Way: Jan Web-based Services: Pre-Science Find data Minutes Retrieve high volume data Days for exploration Feb Read Data Learn formats and develop readers Miradr Extract Parameter Extractparameters Use the best data for the final analysis Mar Subset Spatially DO SCIENCE Perform spatial and other subsetting Derive conclusions Filter Quality Apr Identify quality and other flags and constraints Write the paper Reformat Giovanni Submit the paper Perform filtering/masking Reproject May Visualize Develop analysis and visualization GES DISC tools allow scientists to compress the time needed for pre-science preliminary tasks: data discovery, access, manipulation, visualization, and basic statistical analysis. Explore Accept/discard/get more data (sat, model, ground-based) Jun Analyze Jul DO SCIENCE Aug Sep Scientists have more time to do science. Oct Leptoukh, EPA @UMBC
Example: Comprehensive Multi-Sensor Data Environment for Aerosol Studies Missions Instruments Models Ground-based AERONET GOCART MISR Terra MODIS Aqua OMI Aura US EPA PM2.5 (DataFed) Polder Parasol CALIPSO CALIOP …. …
More than 40 customized Giovanni portals serving various missions and projects • ~ 1500 geophysical parameters/variables • Data (local and remote via FTP, OPeNDAP, WCS) from: • ~ 20 space-based instruments • ~ 50 models • EPA and Aeronet stations • Multiple visualization and statistical analysis functionalities including data intercomparison • Data lineage • Subsetted data downloads in multiple formats • Various maps and plots served via WMS protocol • Serving output data via WCS, KML Giovanni now
Generation 3 Giovanni: Old but improved with more parameters (mostly using Level 3 data)
Giovanni 3 (G3) portals Giovanni Inventory Leptoukh, EPA @UMBC
Air Quality Giovanni portal Leptoukh, EPA @UMBC
Air Quality Multi-Sensor, Model, and Ground-Based Data Support via Giovanni Multi-sensor, model, and ground-based data support with Air Quality Giovanni PM2.5 (EPA DataFed Giovanni Deep Blue MODIS Aerosol Optical Depth The standard MODIS AOT GOCART AOT Leptoukh, EPA @UMBC
Visualizing California’s Wildfires from Space Using GIOVANNI 23-27 October 2007 Data from NASA’s Aura OMI (Tropospheric NO2 and UV Aerosol Index), Aqua AIRS (Total Column CO) and Terra MODIS (Aerosol Small Fraction, Cloud Optical Thickness and Aerosol Mass Concentration Over Land) Tropospheric NO2 Total Column CO UV Aerosol Index OMI OMI AIRS Aerosol Mass over Land Cloud Optical Thickness Aerosol Small Mode Fraction MODIS MODIS MODIS Wildfire Visualization 12 December 2007 Gregory Leptoukh 2007 Fall AGU Meeting San Francisco, CA 10 Leptoukh, EPA @UMBC
Model intercomparison • HTAP Giovannisupports the Hemispheric Transport of Air Pollution (HTAP) Model Intercomparison. • There is potential to expand it for comparison with additional remote sensing data sets. Leptoukh, EPA @UMBC
Giovanni Applications Projects 5/6/2009 Intro instances data aerosols A-Train examples applications quality future
Different levels of multi-sensor activities • Archiving data from multiple sensors. Done. • Harmonizing metadata. Done… more or less. • Accessing data from remote locations. Done • Harmonizing data formats for joint processing (Giovanni). Done. • Serving multi-sensor data via common protocols. Done. • Scale harmonization (Giovanni) – regridding. Done (horizontal only) • Harmonizing visualization (Giovanni, ACP). Done. • Joint analysis (Giovanni). Done and ongoing. • Merging similar parameters (Giovanni). Prototype done for Level 3. • Harmonizing quality. Working on it. • Harmonizing provenance (Measures, Giovanni, MDSA). Started. • Adjusting bias using Neural Network approach. Done. • Merging L2 data. Done • Fusing complementary geophysical variables. Future. Leptoukh, EPA @UMBC
Giovanni Data sources and their access protocols Leptoukh, EPA @UMBC
Peer-reviewed publications using and acknowledging Giovanni (as of Nov 1, 2011) Leptoukh, EPA @UMBC
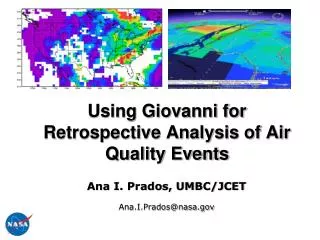
AeroStat: NASA Giovanni Tool for Statistical Intercomparison of Aerosols
What is AeroStat? • AeroStat is a new NASA Giovanni (generation 4) online visualization and statistical portal. • It is an online environment for the direct statistical intercomparison of global aerosol parameters, in which the provenance and data quality can be easily accessed by scientists. • AeroStat also provides a collaborative research environment where scientists can seamlessly share AeroStat workflow execution, algorithms, best practices, known errors and other pertinent information with the science community. Leptoukh, EPA @UMBC
Motivation • Different papers suggested different views on the quality of MODIS and MISR aerosol products. • Peer-reviewed papers are usually behind the latest version of the data. • Difficult to verify/reproduce results from various published paper • Difficult to combine consistently adjusted measurements • In need of an online shareable environment where data processing and analysis can be done in a transparent way by any user of this environment and can be shared amongst all the members of the aerosol community. Leptoukh, EPA @UMBC
What can AeroStat do? • Provide an effective tool for comparing satellite and ground-based aerosol Level 2 data • Provide an environment for colocation and comparison methods with detailed documentation • Provide aerosol bias adjustment to satellite data based on ground-based measurement • Explore aerosol phenomena by merging multi-sensor data • Enable easy sharing of results Leptoukh, EPA @UMBC
Goals • Provide an easy-to-use collaborative environment for exploring aerosol phenomena using multi-sensor data • Provide consistent services with multi-sensor aerosol data • Provide a transparent environment to colocation and comparison methods with detail documentation • Provide easy sharing of results Leptoukh, EPA @UMBC
AeroStat Giovanni Architectural Diagram Giovanni Social Network Giovanni AeroStat Bias Adjustment Satellite Data Data Quality Data Merge Ground-Based Data Lineage Process Filters Data Statistical Analysis Real-Time Collaboration Leptoukh, EPA @UMBC
AeroStat Giovanni Data Support data from Level 2 Measurements • Original Level 2 Products • AERONET Level 2 • MODIS Terra Level 2 • MODIS Aqua Level 2 • MISR Level 2 • Derived Products • Satellite Colocated with AERONET stations: MAPSS Database • Cross Satellite Colocations: Near-neighbor search algorithm (being integrated) Leptoukh, EPA @UMBC
AeroStat Giovanni Architectural Diagram Giovanni Social Network Giovanni AeroStat Bias Adjustment Satellite Data Data Quality Data Merge Ground-Based Data Lineage Process Filters Data Statistical Analysis Real-Time Collaboration Leptoukh, EPA @UMBC
Data Quality and No. of pixels Filters Defaults: Science Team recommended filters Leptoukh, EPA @UMBC
AeroStat Giovanni Architectural Diagram Leptoukh, EPA @UMBC
Bias Adjustment Using Neural Network Leptoukh, EPA @UMBC
AeroStat Giovanni Architectural Diagram Giovanni Social Network Giovanni AeroStat Bias Adjustment Satellite Data Data Quality Data Merge Ground-Based Data Lineage Process Filters Data Statistical Analysis Real-Time Collaboration Leptoukh, EPA @UMBC
AeroStat Giovanni Services • Data colocated with AERONET • Time Series with QA filtering and bias adjustment options • Scatter Plot with QA filtering and bias adjustment options • Colocated satellite data only (cross satellite) • Gridded Lat-Lon Maps for individual parameters with QA filtering and bias adjustment options • Merged Multi-sensor gridded Lat-Lon Maps with QA filtering and bias adjustment options Leptoukh, EPA @UMBC
Time Series (with various filters) Leptoukh, EPA @UMBC
Scatter Plots Bias adjustment No filters Default (Science Team recommended) filters Leptoukh, EPA @UMBC
Gridded Maps Leptoukh, EPA @UMBC
Level 2 data merged Leptoukh, EPA @UMBC
AeroStat Giovanni Architectural Diagram Giovanni Social Network Giovanni AeroStat Bias Adjustment Satellite Data Data Quality Data Merge Ground-Based Data Lineage Process Filters Data Statistical Analysis Real-Time Collaboration Leptoukh, EPA @UMBC
Gsocial (Giovanni Social Network) Gsocial participants can save results, annotate plots, share with others, reproduce their and others’ results (!), and continue sharing. Leptoukh, EPA @UMBC
Research notebook Leptoukh, EPA @UMBC
Science Application Example Leptoukh, EPA @UMBC
Final Touchups before the AeroStat public release • Add bias adjustment for MISR colocated with AERONET data (ran into some version mixture at Langley) • Add bias (to Aeronet) adjustment for “Satellite Only” service • Routinely process and ingest for colocated satellite and AERONET data • Fold AeroStat Giovanni into mainstream Giovanni • Add features based on users feedback (e.g., log-log for scatter plots) Leptoukh, EPA @UMBC
Why so much attention to Data Quality now? • In the past, it was difficult to access satellite data. • Now, within minutes, a user can find and access multiple datasets from various remotely located archives via web services and perform a quick analysis. • This is the so-called Data Intensive Science. • The new challenge is to quickly figure out which of those multiple and easily accessible data are more appropriate for a particular use. • However, our remote sensing data are not ready for this challenge – there is no consistent approach for characterizing quality of our data. • This is why data quality is hot now. Leptoukh, EPA @UMBC
Why so difficult? • Quality is perceived differently by data providers and data recipients. • Many different qualitative and quantitative aspects of quality. • No comprehensive framework for remote sensing Level 2 and higher data quality • No preferred methodologies for solving many data quality issues • Data quality aspect had lower priority than building an instrument, launching a rocket, collecting/processing data, and publishing a paper using these data. • Each science team handled quality differently. Leptoukh, EPA @UMBC
Expectations for Data Quality • What do users want? • Gridded non-gappy data with error bars in each grid cell • What do they get instead? • Level 2 swath in satellite projection with some obscure quality flags that mean nothing to users • Level 3 monthly data with a lot of aggregation (not always clearly described) and standard deviation as an uncertainty measure (fallacy) Leptoukh, EPA @UMBC
Different perspectives Data providers: demigods looking from above MISR We have good data We have good data MODIS MLS OMI TES I need good new data … and quickly. A new data product could be very good, but if it is not being conveniently served and described, it is not good for me… So I am going to use whatever I have and know already. User Leptoukh, EPA @UMBC
Data provider vs. User perspective • Algorithm developers and Data providers: solid science + validation • Users: fitness for purpose • Measuring Climate Change: • Model validation: gridded contiguous data with uncertainties • Long-term time series: bias assessment is the must , especially sensor degradation, orbit and spatial sampling change • Studying phenomena using multi-sensor data: • Cross-sensor bias is needed • Realizing Societal Benefits through Applications: • Near-Real Time for transport/event monitoring - in some cases, coverage and timeliness might be more important that accuracy • Educational (generally not well-versed in the intricacies of quality) – only the best products Leptoukh, EPA @UMBC
Different kinds of reported and perceived data quality • Pixel-level Quality (reported): algorithmic guess at usability of data point (some say it reflects the algorithm “happiness”) • Granule-level Quality: statistical roll-up of Pixel-level Quality • Product-level Quality (wanted/perceived): how closely the data represent the actual geophysical state • Record-level Quality: how consistent and reliable the data record is across generations of measurements Different quality types are often erroneously assumed having the same meaning Different focus and action at these different levels to ensure Data Quality Leptoukh, EPA @UMBC
General Level 2 Pixel-Level Issues • How to extrapolate validation knowledge about selected Level 2 pixels to the Level 2 (swath) product? • How to harmonize terms and methods for pixel-level quality? AIRS Quality Indicators MODIS Aerosols Confidence Flags Ocean Land • Very Good • 2 Good • 1 Marginal • 0 Bad • Very Good • 2 Good • 1 Marginal • 0 Bad 0 Best Data Assimilation Good Climatic Studies Do Not Use Purpose Use these flags in order to stay within expected error bounds Match up the recommendations? Ocean Land Leptoukh, EPA @UMBC ±0.05 ± 0.15 t ±0.03 ± 0.10 t
Data Quality vs. Quality of Service • A data product could very good, • But if not being conveniently served and described, is perceived as not being so good… User perspective: • There might be a better product somewhere but if I cannot easily find it and understand it, I am going to use whatever I have and know already. Leptoukh, EPA @UMBC
QI: Spatial completeness (coverage): Aerosol Optical Depth (AOD) MODIS Aqua MISR Spatial coverage (%) for different latitudinal zones and seasons: Due to a wider swath, MODIS AOD covers more area than MISR. The seasonal and zonal patterns are rather similar Leptoukh, EPA @UMBC
Data provider quality indicators vs. user QI • EPA requirements for air pollution: • Very specific Quality Indicators, e.g., PM2.5 concentration • Satellite-measured aerosols are characterized by aerosol scientists. Aerosol Optical Depth (AOD) is not the same as PM2.5 • Are these quality indicators compatible? • Can one be mapped to another? • Does very accurate AOD measurement correspond to accurate PM2.5? Usually not… Leptoukh, EPA @UMBC