Download
1 / 1
10 likes | 106 Views
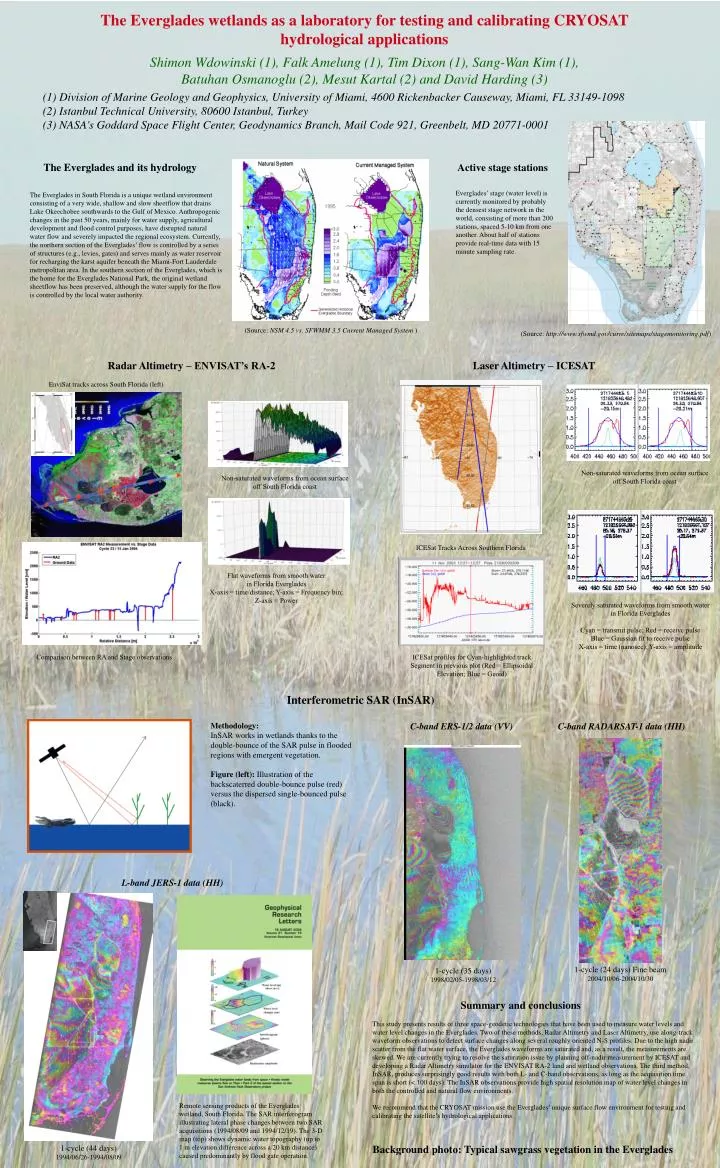
The Everglades wetlands as a laboratory for testing and calibrating CRYOSAT hydrological applications Shimon Wdowinski (1), Falk Amelung (1), Tim Dixon (1), Sang-Wan Kim (1), Batuhan Osmanoglu (2), Mesut Kartal (2) and David Harding (3)

E N D
The Everglades wetlands as a laboratory for testing and calibrating CRYOSAT hydrological applications Shimon Wdowinski (1), Falk Amelung (1), Tim Dixon (1), Sang-Wan Kim (1), Batuhan Osmanoglu (2), Mesut Kartal (2) and David Harding (3) (1) Division of Marine Geology and Geophysics, University of Miami, 4600 Rickenbacker Causeway, Miami, FL 33149-1098 (2) Istanbul Technical University, 80600 Istanbul, Turkey (3) NASA's Goddard Space Flight Center, Geodynamics Branch, Mail Code 921, Greenbelt, MD 20771-0001 The Everglades and its hydrology Active stage stations Everglades’ stage (water level) is currently monitored by probably the densest stage network in the world, consisting of more than 200 stations, spaced 5-10 km from one another. About half of stations provide real-time data with 15 minute sampling rate. The Everglades in South Florida is a unique wetland environment consisting of a very wide, shallow and slow sheetflow that drains Lake Okeechobee southwards to the Gulf of Mexico. Anthropogenic changes in the past 50 years, mainly for water supply, agricultural development and flood control purposes, have disrupted natural water flow and severely impacted the regional ecosystem. Currently, the northern section of the Everglades’ flow is controlled by a series of structures (e.g., levies, gates) and serves mainly as water reservoir for recharging the karst aquifer beneath the Miami-Fort Lauderdale metropolitan area. In the southern section of the Everglades, which is the home for the Everglades National Park, the original wetland sheetflow has been preserved, although the water supply for the flow is controlled by the local water authority. (Source: NSM 4.5 vs. SFWMM 3.5 Current Managed System ) (Source: http://www.sfwmd.gov/curre/sitemaps/stagemonitoring.pdf) Radar Altimetry – ENVISAT’s RA-2 Laser Altimetry – ICESAT EnviSat tracks across South Florida (left) Non-saturated waveforms from ocean surface off South Florida coast Non-saturated waveforms from ocean surface off South Florida coast ICESat Tracks Across Southern Florida Flat waveforms from smooth water in Florida Everglades X-axis = time/distance; Y-axis = Frequency bin; Z-axis = Power Severely saturated waveforms from smooth water in Florida Everglades Cyan = transmit pulse; Red = receive pulse Blue = Gaussian fit to receive pulse X-axis = time (nanosec); Y-axis = amplitude Comparison between RA and Stage observations ICESat profiles for Cyan-highlighted track Segment in previous plot (Red = Ellipsoidal Elevation; Blue = Geoid) Interferometric SAR (InSAR) Methodology: InSAR works in wetlands thanks to the double-bounce of the SAR pulse in flooded regions with emergent vegetation. Figure (left): Illustration of the backscaterred double-bounce pulse (red) versus the dispersed single-bounced pulse (black). C-band ERS-1/2 data (VV) C-band RADARSAT-1 data (HH) L-band JERS-1 data (HH) 1-cycle (24 days) Fine beam 2004/10/06-2004/10/30 1-cycle (35 days) 1998/02/05-1998/03/12 Summary and conclusions This study presents results of three space-geodetic technologies that have been used to measure water levels and water level changes in the Everglades. Two of these methods, Radar Altimetry and Laser Altimetry, use along-track waveform observations to detect surface changes along several roughly oriented N-S profiles. Due to the high nadir scatter from the flat water surface, the Everglades waveforms are saturated and, as a result, the measurements are skewed. We are currently trying to resolve the saturation issue by planning off-nadir measurement by ICESAT and developing a Radar Altimetry simulator for the ENVISAT RA-2 land and wetland observations. The third method, InSAR, produces surprisingly good results with both L- and C-band observations, as long as the acquisition time span is short (< 100 days). The InSAR observations provide high spatial resolution map of water level changes in both the controlled and natural flow environments. We recommend that the CRYOSAT mission use the Everglades’ unique surface flow environment for testing and calibrating the satellite’s hydrological applications. Remote sensing products of the Everglades wetland, South Florida. The SAR interferogram illustrating lateral phase changes between two SAR acquisitions (1994/08/09 and 1994/12/19). The 3-D map (top) shows dynamic water topography (up to 1 m elevation difference across a 20 km distance) caused predominantly by flood gate operation. 1-cycle (44 days) 1994/06/26-1994/08/09 Background photo: Typical sawgrass vegetation in the Everglades