Download
1 / 22
220 likes | 382 Views
Field to Market The Keystone Alliance for Sustainable Agriculture. Background Information. Who is the Keystone Center?. The Keystone Center for Science and Public Policy promotes practical solutions to energy, environment, and public health problems

E N D
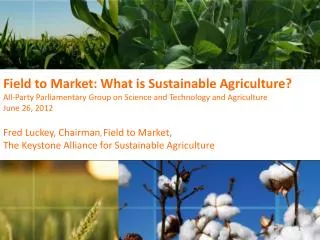
Field to MarketThe Keystone Alliance for Sustainable Agriculture Background Information
Who is the Keystone Center? The Keystone Center for Science and Public Policy promotes practical solutions to energy, environment, and public health problems encourages creative thinking and collaborative decision-making is committed to convening the right people, using reliable scientific information, and building trust and understanding We serve as neutral conveners, independently facilitating and mediating: stakeholder dialogues public engagement processes joint fact-finding advisory boards Keystone Science School Uses models above to provide science-based teacher training and educational experiences for middle and high school students
What is Field to Market? • A collaborative stakeholder group of producers, agribusinesses, food and retail companies, conservation organizations, universities, and NRCS • Focusing on defining and measuring the sustainability of food and fiber production • Developing outcomes-based metrics • Measuring the environmental and socioeconomic impacts of agriculture • Providing tools to help growers analyze operations and food companies explain how natural resources are being managed
Why Field to Market? • FTM is a leader in addressing this challenge by… • Bringing together the entire supply chain, plus conservation, university, and agency partners • Focusing on commodity crops, which represent the vast majority of production and are unique in their supply chains • Being science and outcomes based, and technology-neutral
Field to Market Strategies • Define and communicate the challenge for agriculture • Complete suite of sustainability metrics for commodity agriculture with methods for applying them at multiple scales (national to field level) • Create shared value throughout supply chain
First Step: Initial Environmental Indicator Report January 2009
Report Conclusions • Production agriculture has become increasingly efficient for many crops and indicators, relying on fewer inputs to produce more • For example, soil loss trends have improved substantially by 30 to nearly 70 percent for the four crops evaluated • Suggests progress toward meeting the increasing demand while achieving lesser environmental impact per unit of output produced • The report does not define a benchmark level for sustainability, but does provide context for focusing on specific challenges and scales
Corn: Summary of Results Per bushel findings: Productivity (yield per acre) increased 41 percent Land usedecreased 37 percent Soil lossdecreased 69 percent Irrigation water use has been variable, with an average 27 percent decrease Energy use decreased 37 percent Greenhouse gas emissions decreased 30 percent Total annual trends indicate increases in total annual energy use (28 percent), water use (17 percent), and greenhouse gas emissions (34 percent). Total annual soil loss has decreased 33 percent.
Cotton: Summary of Results Per pound findings: Productivity (yield per acre) increased 31 percent Land use per pound produced has decreased 25 percent Soil loss decreased 34 percent Irrigation water use per incremental pound of cotton produced (above that expected without irrigation) decreased by 49 percent Energy use energy use per pound decreased 66 percent Greenhouse gas emissions per pound fluctuated. More recent improvements resulting in a 33 percent average decrease Total annual trends indicate soil loss and climate impact in 2007 are similar to the impact in 1987, with average trends over the study period remaining relatively flat. Total energy use decreased 45 percent and total water use decreased 26 percent.
Soybeans: Summary of Results Per bushel findings: Productivity (yield per acre) increased steadily by 29 percent Land use efficiency per bushel improved by 26 percent Soil loss decreased 49 percent Irrigation water use improved 20 percent Energy use decreased 65 percent Greenhouse gas emissions decreased 38 percent Total annual trends indicate soybean production’s total energy use decreased 29 percent, soil loss decreased 11 percent, irrigation water use increased 39 percent, and climate impact increased 15 percent.
Wheat: Summary of Results Per bushel findings: Productivity (yield per acre) increased by 19 percent Land use was variable, with an average overall decrease of 17 percent Soil loss improved 50 percent with most improvements over the first half of the study period Irrigation water use per bushel produced due to irrigation showed an average flat trend Energy use decreased nine percent Greenhouse gas emissions increased 15 percent, with a larger increase in the latter half of the study period Total annual trends indicate total energy use and total irrigation water use were similar in 1987 and 2007, with average trends showing an 18 percent decrease in total energy use and an 11 percent decrease in total water use. Total soil loss has decreased 54 percent. Total climate impact has increased an average of five percent over the study period, with a more significant increase over the past decade.
Fieldprint CalculatorTrial Launch June 2009Version 2.0 Release: January 2012
What is the Fieldprint Calculator? • A free online tool for growers to assess the efficiency of their operations to make informed natural resource management decisions • Allows farmers to voluntarily and confidentially evaluate their operations against an national and state averages • Analyzes use of natural resources (land, topsoil, and water) and crop production inputs (energy, nutrients, crop protection products) • Helps farmers to analyze how their choices impact natural resources and operational efficiency
Fieldprint Calculator • Developed to accelerate gains made inside the farm gate and explain those practices outside the farm gate • May help growers and food companies answer consumers questions about how products are produced • Lays foundation to document improvements • Can tie to programs being implemented throughout the food chain to improve sustainability as a whole
Continued Development • New version coming in 2012 • Will incorporate NRCS RUSLE2 • Will include • Ability to save field information and scenarios • Consideration of rotations over 5 years • A qualitative soil carbon metric • Enterprise budgeting • Rice • A mapping function • Future versions may include additional crops and additional indicators
Field to Market Pilots • Bunge, Kellogg & Nebraska corn growers explored the fieldprint for Frosted Flakes • Corn growers in the Paw Paw watershed of Michigan are working with Van Buren Conservation District, The Coca-Cola Company, The Nature Conservancy, and World Wildlife Fund to analyze management practices • Cotton growers in Louisiana and Texas will explore management practices and connections to NRCS programs • Wheat growers in Idaho are working with General Mills and Syngenta to explore practices and outcomes • Rice, wheat, soybean, cotton, and corn growers in the Southeast worked with Syngenta to explore sustainable practices and identify economic benefits, using FTM metrics and Syngenta’s Land.db tool • Oat growers in Canada are working with General Mills to identify historical trends and explore practices for Cheerios
Questions/Contact Information Sarah Stokes Alexander, Director, Sustainability and Leadership Programs 970-513-5846; salexander@keystone.org Julie Shapiro, Associate 970-513-5830; jshapiro@keystone.org Field to Market Website (includes Fieldprint Calculator and background information) http://www.fieldtomarket.org 22