Download
1 / 65
720 likes | 1.25k Views
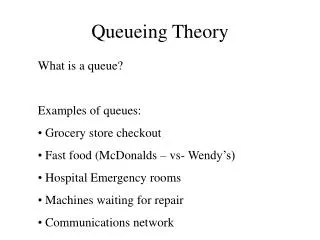
Queueing Theory. Overview. Basic definitions and metrics Examples of some theoretical models. Basic Queueing Theory. A set of mathematical tools for the analysis of probabilistic systems of customers and servers.

E N D
Overview • Basic definitions and metrics • Examples of some theoretical models Operations -- Prof. Juran
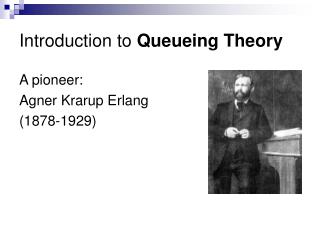
Basic Queueing Theory • A set of mathematical tools for the analysis of probabilistic systems of customers and servers. • Can be traced to the work of A. K. Erlang, a Danish mathematician who studied telephone traffic congestion in the first decade of the 20th century. • Applications: • Service Operations • Manufacturing • Systems Analysis Operations -- Prof. Juran
Service Process Servers Queue or Waiting Line Exit Arrival Process Components of a Queuing System
Customer Population Sources Population Source Finite Infinite Example: Number of machines needing repair when a company only has three machines. Example: The number of people who could wait in a line for gasoline.
Service Pattern Service Pattern Constant Variable Example: Items coming down an automated assembly line. Example: People spending time shopping.
One-person barber shop Car wash Bank tellers’ windows Hospital admissions Examples of Queue Structures Single Phase Multiphase Single Channel Multichannel
Balking and Reneging No Way! No Way! Balking: Arriving, but not joining the queue Reneging: Joining the queue, then leaving
Suggestions for Managing Queues • Determine an acceptable waiting time for your customers • Try to divert your customer’s attention when waiting • Inform your customers of what to expect • Keep employees not serving the customers out of sight • Segment customers
Suggestions for Managing Queues • Train your servers to be friendly • Encourage customers to come during the slack periods • Take a long-term perspective toward getting rid of the queues Source: Katz, Larson, Larson (1991)
Arrival Rate refers to the average number of customers who require service within a specific period of time. A Capacitated Queue is limited as to the number of customers who are allowed to wait in line. Customers can be people, work-in-process inventory, raw materials, incoming digital messages, or any other entities that can be modeled as lining up to wait for some process to take place. A Queue is a set of customers waiting for service. Operations -- Prof. Juran
Queue Discipline refers to the priority system by which the next customer to receive service is selected from a set of waiting customers. One common queue discipline is first-in-first-out, or FIFO. A Server can be a human worker, a machine, or any other entity that can be modeled as executing some process for waiting customers. Service Rate (or Service Capacity) refers to the overall average number of customers a system can handle in a given time period. Stochastic Processes are systems of events in which the times between events are random variables. In queueing models, the patterns of customer arrivals and service are modeled as stochastic processes based on probability distributions. Utilization refers to the proportion of time that a server (or system of servers) is busy handling customers. Operations -- Prof. Juran
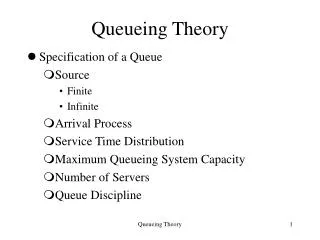
In the literature, queueing models are described by a series of symbols and slashes, such as A/B/X/Y/Z, where • A indicates the arrival pattern, • B indicates the service pattern, • X indicates the number of parallel servers, • Y indicates the queue’s capacity, and • Z indicates the queue discipline. • We will be concerned primarily with the M/M/1 queue, in which the letter M indicates that times between arrivals and times between services both can be modeled as being exponentially distributed. The number 1 indicates that there is one server. • We will also study some M/M/s queues, where s is some number greater than 1. Operations -- Prof. Juran
Be careful! These symbols can vary across different books, professors, etc. Operations -- Prof. Juran
General (all queue models) Single Phase Infinite Source FCFS Discipline Infinite Queue Length M/M/1 (Model 1) Single Server M/M/S M/D/1 (Model 2) M/M/2 (Model 3) Operations -- Prof. Juran
General Formulas Operations -- Prof. Juran
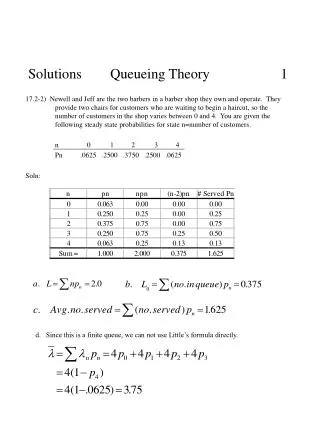
The single most important formula in queueing theory is called Little’s Law: Little’s Law applies to any subsystem as well. For example, Operations -- Prof. Juran
General Single-Server Formulas Operations -- Prof. Juran
There aren’t many general queueing results (see Larry Robinson’s sheet for some of them). • Much of queueing theory consists of making assumptions about the specific type of queue. • The class of models with the most analytical results is the category in which the arrival process and/or service process follows an exponential distribution. Operations -- Prof. Juran
Example: General Formula I Average line length c Number of servers CiCoefficient of variation; arrival process CpCoefficient of variation; service process Coefficient of Variation: Operations -- Prof. Juran
The Exponential Distribution T is a continuous positive random number. t is a specific value of T. Operations -- Prof. Juran
Here’s how to do this calculation in Excel: The EXP function raises e to the power of whatever number is in parentheses. Operations -- Prof. Juran
Remember that the exponential distribution has a really long tail. In probability-speak, it has strong right-skewness, and there are outliers with very large values. In fact, the probability of any one inter-event time being longer than the mean inter-event time is: In other words, only 37% of inter-event times will be longer than the expected value of the inter-event times. This counter-intuitive result is because some of the 37% are really, really long. Operations -- Prof. Juran
Other Facts about the Exponential Distribution • “Memoryless” property: The expected time until the next event is independent of how long it’s been since the previous event • The mean is equal to the standard deviation (so the CV is always 1) • Analogous to the discrete Geometric distribution Operations -- Prof. Juran
If the random time between events is exponentially distributed, then the random number of events in any given period of time follows a Poisson process. A Poisson random variable is discrete. The number of events n (i.e. arrivals) in a certain space of time must be an integer. n is a positive random integer (sometimes zero). Operations -- Prof. Juran
In English: The probability of exactly n events within t time units. Operations -- Prof. Juran
Poisson distribution; λ = 7.5 Operations -- Prof. Juran
The Excel formula is good for figuring out the probability distribution for the number of events in one time unit. Here is a more general approach: This gives the probability of exactly fifteen events in three time units, when the average number of events per time unit is 7.5. You could adapt the Excel formula for general purposes by re-defining what “one time unit” means. Operations -- Prof. Juran
Waiting Line Models • These four models share the following characteristics: • Single Phase • Poisson Arrivals • FCFS Discipline • Unlimited Queue Capacity
Model 1 (M/M/1) Formulas Operations -- Prof. Juran
Model 1 (M/M/1) Formulas Operations -- Prof. Juran
Model 1 (M/M/1) Formulas Operations -- Prof. Juran
Model 1 (M/M/1) Formulas Operations -- Prof. Juran
Example: Model 1 (M/M/1) Assume a drive-up window at a fast food restaurant. Customers arrive at the rate of 25 per hour. The employee can serve one customer every two minutes. Assume Poisson arrival and exponential service rates. • Determine: • What is the average utilization of the employee? • What is the average number of customers in line? • What is the average number of customers in the system? • What is the average waiting time in line? • What is the average waiting time in the system? • What is the probability that exactly two cars will be in the system?
Example: Model 1 (M/M/1) A) What is the average utilization of the employee?
Example: Model 1 B) What is the average number of customers in line? C) What is the average number of customers in the system?
Example: Model 1 D) What is the average waiting time in line? E) What is the average time in the system?
Example: Model 1 F) What is the probability that exactly two cars will be in the system (one being served and the other waiting in line)?
M/D/1 Formulas Operations -- Prof. Juran
Example: Model 2 (M/D/1) An automated pizza vending machine heats and dispenses a slice of pizza in 4 minutes. Customers arrive at an average rate of one every 6 minutes, with the arrival rate exhibiting a Poisson distribution. Determine: A) The average number of customers in line. B) The average total waiting time in the system.
Example: Model 2 A) The average number of customers in line. B) The average total waiting time in the system.
M/M/S Formulas Operations -- Prof. Juran