Download
1 / 22
220 likes | 279 Views
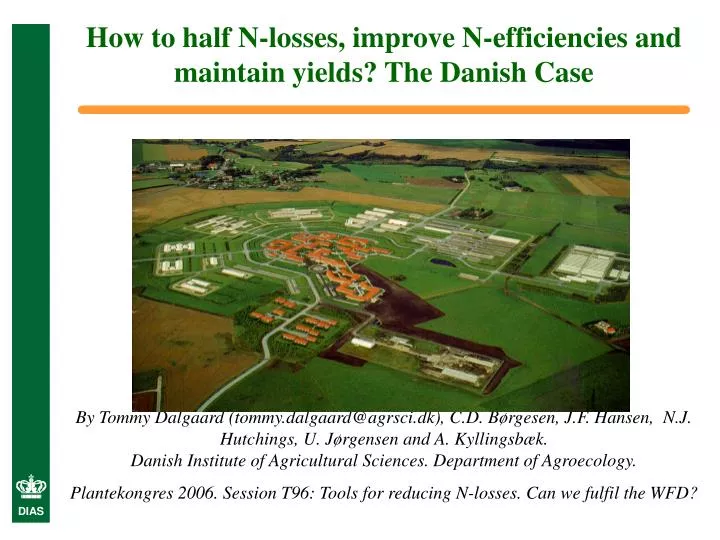
How to half N-losses, improve N-efficiencies and maintain yields? The Danish Case.

E N D
How to half N-losses, improve N-efficiencies and maintain yields? The Danish Case By Tommy Dalgaard (tommy.dalgaard@agrsci.dk), C.D. Børgesen, J.F. Hansen, N.J. Hutchings, U. Jørgensen and A. Kyllingsbæk. Danish Institute of Agricultural Sciences. Department of Agroecology. Plantekongres 2006. Session T96: Tools for reducing N-losses. Can we fulfil the WFD?
Programme • Agriculture & Environmental problems __in Denmark • Developments in the N balance • N-yields versus N-losses • Catalogue of statutory measures to __improve N-management • _- How half N-losses and maintain yields?
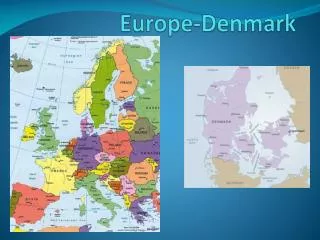
Intensive agriculture in Denmark • 2,7 mio ha agricultural land (63% of total area) • 5 mio people - 4,5 mio t milk - 24 mio pigs/yr • 8 t milk/cow/yr • 24 piglets/sow/yr • 7,5 t wheat/ha/yr • 7500 km coastline • Drinking water = groundwater
Dairy Cows Pigs Wheat(1000’s) (1000’s) (1000 ha)
Development phases N-imports N-exports NB: year 2000= index 100
I: Traditional livestock farming (1900-1950) I I NB: year 2000= index 100
II: The green revolution (1950-1983) I II I II NB: year 2000= index 100
III: Sustainable development (1984-?) I II III I II III NB: year 2000= index 100
Action plans to reduce N-losses • 1985: Action plan to reduce N- and P-pollution • 1987: First action plan for the aquatic environment (AP-I) • (Aim: half N-losses and reduce P-losses by 80%) • 1991: Action plan for sustainable agriculture • 1998: Second Action Plan (AP-II) • 2000: AP-II midterm evaluation and enforcement • 2001: Ammonia Action Plan • 2004: Third Action Plan (AP-III)
Summary • Improved N-management via: • Mandatory fertilisation accounts • Norms for fertilisation of crops • Subsidies for new manure equipment and __environmental friedly practices • Extensive research, demonstration and __advisory programmes • Better utilisation of manures
Norms for manure N-utilisation% plant available N in manures
Conclusion • The regulations have been succesfull and might serve as inspiration for other countries • N-leaching almost halved from 1985-2004 • Livestock production increased by 30% • N crop yields sustained • Still posibilities and environmental needs for improvements. • Better methods for regionalised assessments needed for the implementation of the WFD