Download
1 / 13
130 likes | 232 Views
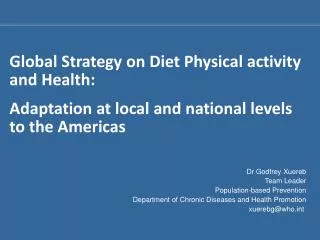
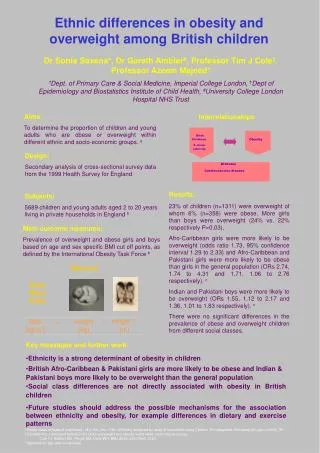
Ethnic differences in obesity, diet and physical activity. Vanessa Higgins & Angela Dale Centre for Census & Survey Research University of Manchester. Background. In England, almost two-thirds of adults and a third of children are either overweight or obese

E N D
Ethnic differences in obesity, diet and physical activity Vanessa Higgins & Angela Dale Centre for Census & Survey Research University of Manchester
Background • In England, almost two-thirds of adults and a third of children are either overweight or obese • Government estimates that without action this will rise to almost 9 in 10 adults and two-thirds of children by 2050 • Obesity linked to increased risks of diabetes, heart disease, cancer • Government strategies • “Healthy Weight, Healthy Lives”, Jan 2008. Identifies 5 areas for tackling excess weight including promotion of healthier food and physical exercise • Diet (5 a day; food labelling; restrictions on advertising to children; school-meals) • Physical activity guidelines • Some recognition of cultural/ethnic differences in these strategies but need more
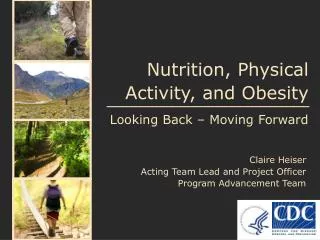
Aims of the project • Analyse ethnic differences in three outcomes: • Obesity • Diet • Physical activity • Use Health Survey for England from 1999 and 2004 (ethnic boosts) • Explanatory variables: gender, age, generation, social class, educational level, religion, type of neighbourhood etc (diet and physical activity for obesity) • Parental diet, physical activity, obesity and other characteristics • Assess change between 1999 and 2004
Aged 16+, Base (unweighted) 11022 Source: Health Survey for England 2004
Obesity and ethnicity • Age: increase in obesity prevalence with age was marked among Black Caribbean, Black African and Indian women. • Children: Black Caribbean and Pakistani girls at increased risk of obesity and Pakistani and Indian boys are more likely to be overweight. HSE 2004 shows BA boys at risk of obesity. • Issues of socio-economic confounders – is this a real relationship • Abdominal obesity in South Asians • Body Mass Index or Waist circumference? • different BMI cut-offs for Asians?
Aged 16+, Base (unweighted) 13515 Source: Health Survey for England 2004
Diet and ethnicity • All minority ethnic groups have healthier diet than general population. • Other literature confirms UK South Asian and Afro-Caribbean diets generally healthier than white population. Evidence of high quantities consumed in Caribbean diet • Heterogeneity of South Asian and Afro-Caribbean: religion, region etc • Cultural beliefs: mealtime structures, significance of food • Migration: modification of traditional diet when move to UK, adoption of fast foods, time since immigration • Age: fruit and veg consumption highest among older groups. Do older people retain traditional eating patterns that may not be followed by younger generations?
Aged 16+, Base (unweighted) 13482 Source: Health Survey for England 2004
Physical activity and ethnicity • Smaller scale studies support HSE findings of low levels of physical activity among South Asians. Extends to children and young people • Cultural barriers: language, dress code, modesty and lack of single-sex facilities, concept of physical activity to Bangladeshis. Also non-cultural issues, don’t over-emphasise cultural barriers • Migration: do British born South Asians do more physical activity than first generation? Does length of time since immigration affect activity levels? • Lack of literature on physical activity of other ethnic minority groups in UK!
Operationalisation (2004) • Diet • Summary measure of fruit and vegetable consumption based on the 5-a-day guidelines (aged 5+) • Separate components of fruit and vegetable consumption (aged 5+) • Salad, pulses, vegetables, composite dishes, fruit juice, fresh fruit, dried fruit, frozen or tinned fruit, other dishes made from fruit • Summary measure of fat scores (aged 16+) • Separate components of fatty foods consumed (aged 16+) • Milk, cheese, red meat, white meat, fish, fried food, sweet/savoury snacks, pastries, butter/ghee, reduced fat spreads, oils • Salt added in cooking and at table (aged 16+)
Operationalisation (2004) • Physical activity of adults (aged 16+) • Summary measure based on current guidelines of 30+ mins of activity of moderate intensity 5+ days week • Low activity: less than once a week • High activity: at least 5 days a week • Separate components: sports/exercise; brisk walks; heavy housework/gardening/DIY; occupational activity • Physical activity of children (aged 5-15) • Summary measure based on current guidelines of 1 hour+ of moderate intensity per day • Separate components: sports/exercise; walking; active play; housework/gardening • Obesity • Body Mass Index (weight in kgs/height in metres²). WHO cut off points for obesity for adults and children • Waist Circumference
Summary • Use HSE to analyse ethnic differences in obesity, diet and physical activity • Highlighted some of the complexities of measuring outcome variables and some explanations for observed differences • We will use standard measures but also implement alternatives • Explanatory work and regression models
Our contact details: vanessa.higgins@manchester.ac.uk Centre for Census and Survey Research University of Manchester 0161 275 7766 angela.dale@manchester.ac.uk Centre for Census and Survey Research University of Manchester 0161 275 4876