Download
1 / 22
230 likes | 373 Views
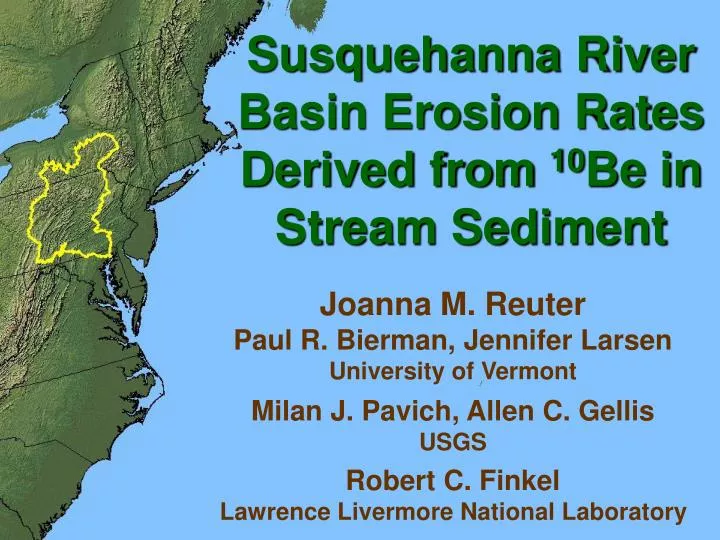
Susquehanna River Basin Erosion Rates Derived from 10 Be in Stream Sediment. Joanna M. Reuter Paul R. Bierman, Jennifer Larsen University of Vermont Milan J. Pavich, Allen C. Gellis USGS Robert C. Finkel Lawrence Livermore National Laboratory. Erosion rates on a millennial time scale?

E N D
Susquehanna River Basin Erosion Rates Derived from 10Be in Stream Sediment Joanna M. Reuter Paul R. Bierman, Jennifer Larsen University of Vermont Milan J. Pavich, Allen C. Gellis USGS Robert C. Finkel Lawrence Livermore National Laboratory
Erosion rates on a millennial time scale? • Relationships with: • physiographic province? • slope? • lithology? • Comparison with other erosion rate estimates • 1
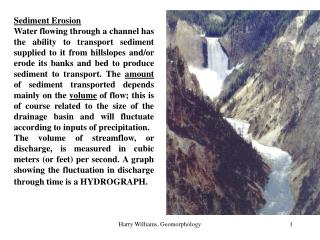
Production of 10Be from cosmic ray bombardment of quartz Cosmic Rays O 10Be Quartz
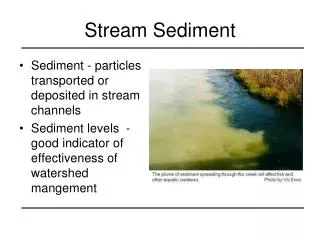
Quartz Depth (meters) Si 26Al O 10Be Production Rate 10Be is a proxy for erosion rate
EXPLANATION USGS gage basins Small basins
EXPLANATION USGS gage basins Small basins
EXPLANATION USGS gage basins Small basins
Appalachian Plateaus n = 22 Basin average erosion rate (meters/ million years) n = 2 n = 1 10Be Small basins sandstone 10Be USGS basins Suspended sediment yield USGS basins
Valley & Ridge Basin average erosion rate (meters/ million years) n = 7 n = 17 n = 9 n = 7 10Be Small basins sandstone 10Be Small basins shale 10Be USGS basins Suspended sediment yield USGS basins
Piedmont 320 m/my Basin average erosion rate (meters/ million years) n = 7 n = 12 n = 6 10Be Small basins schist 10Be USGS basins Suspended sediment yield USGS basins
30 Mean slope of basin (degrees) 20 10 0 Physiographic province summary: small basins Basin average erosion rate (meters/ million years) 10Be Appalachian Plateaus sandstone 10Be Valley & Ridge sandstone 10Be Valley & Ridge shale 10Be Piedmont schist
Does slope matter? Erosion rate (meters/ million years) R2 = 0.72 R2 = 0.51 R2 = 0.37 no correlation
10Be Erosion of the Appalachians 60 50 Erosion rate (meters/ million years) R2 = 0.54 40 30 20 10 0 Smokies data from Matmon et al., 2003
Conclusions • Erosion rate of unglaciated part of Susquehanna River basin: • 16 m/my, with a range from 4 to 54 m/my • Physiographic province matters. • Slope matters. • Lithology shows no clear relation to erosion rates. • Sediment yields are broadly consistent with 10Be erosion rates, except for some Piedmont basins. • A relationship exists between slope and erosion rate across different regions of the Appalachians.
Acknowledgments • Funding: • USGS • NSF • Sample collection & processing: • Eric Butler • Megan McGee • Luke Reusser