Download
1 / 24
240 likes | 570 Views
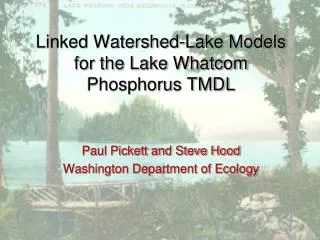
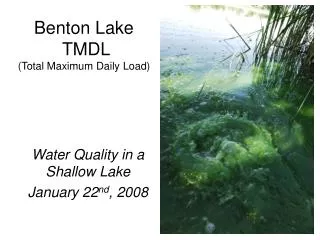
Mead Lake TMDL Critique. Alicia Allen and Nick Grewe. Mead Lake . Shallow eutrophic lake Mean depth 1.5 m, maximum depth 5 m Drains 248 km 2 of west central Wisconsin South Fork Eau Claire River is the primary source of surface water inflow

E N D
Mead Lake TMDL Critique Alicia Allen and Nick Grewe
Mead Lake • Shallow eutrophic lake • Mean depth 1.5 m, maximum depth 5 m • Drains 248 km2 of west central Wisconsin • South Fork Eau Claire River is the primary source of surface water inflow • Mead Lake was placed on 303(d) list in 1998 due to sediment and Phosphorous • In 2008 was updated as a result of habitat degradation, pH exceedance, and excess algal growth in the summer
Issues • Sediment enters from South Fork Eau Claire River • Phosphorous bound to sediment particles transfers Phosphorous to lake bed • Severe algal blooms during growing season (May-October) • Removal of CO2 through photosynthesis raises pH
Goal • Reduce sediment loading • Reduced sediment will decrease Phosphorous load • Reduced Phosphorous will decrease algal blooms • Algal bloom control will address pH exceedance and degraded habitat • Improve for recreational purposes
Water Quality Standards • Wisconsin has no numeric criteria for Phosphorous and sediment • Narrative criteria: The following should not be present in such amounts as to interfere with public rights in waters of the state • Substances that will cause objectionable deposits on the shore or in the bed of a body of water • Floating or submerged debris, oil, scum, or other materials • Materials producing color, odor, taste, or unsightliness • 93 ppb P- site-specific target developed using criterion
Water Quality Standards • pH standard: “The pH shall be within a range of 6.0-9.0, with no change greater than 0.5 units outside the estimated natural seasonal maximum and minimum” • Based off the designation of Mead Lake as fish and other aquatic life uses • TMDL was not based off of this standard, but was checked against it at the end
Background of Study • 2 year study (2002-2003) of water quality in Mead Lake and South Fork Eau Claire River • Focused on external loading of suspended sediments and nutrients from river, internal P fluxes from lake sediment, and in-lake water quality • South Fork Eau Claire River • Continuous flow monitoring • Bi-weekly and storm event water quality sampling • TSS, total N, total P, soluble reactive P
Background of Study • Mead Lake • Bi-weekly testing at 3 locations from May-September • Total N, Total P, soluble reactive P, chlorophyll • In-situ testing for temperature, DO, pH, and conductivity
Study Findings • TSI>50 = Eutrophic • River accounted for 54% of Total P load to Mead Lake • Exceedance of WQ criteria for pH generally correspond to chlorophyll levels > 70 ug/L
Land Use Modeling • Modeled using SWAT • Simulated runoff, sediment, and P loading • Utilized to assess the effectiveness of reducing phosphorous and sediment loads to Mead Lake • Used • Detailed land management information • 2002 farm survey of 74 farms • 1999 land use survey • 3 crop rotations were used • Calibrated for flows and load data using 2002 values
Conclusions • Change in P export due to different management and land use changes
Lake Modeling • Modeled using BATHTUB • Used various P loading scenarios to predict changes in • Total P • Chlorophyll • Secchi transparency • Algal bloom frequency • Calibrated using 2002 data and compared to collected 2003 data
Conclusions 30 % reduction in external P load decreases Total P by 24%
Loading Capacity • TMDL Load Capacity = WLA + LA + MOS • WLA = Wasteload Allocation • LA = Load Allocation • MOS = Margin of Safety • WLA = 0 because no point sources • Load Capacity = LA + MOS
Load Allocation • Phosphorous • 30% reduction in seasonal P load = 3850 lb • 35% reduction in annual P load = 8600 lb • Sediment • 30% seasonal decrease = 233 tons • 30% annual decrease = 826 tons • Only focused on external P load. Internal load will be addressed after external load is controlled and funds become available
Margin of Safety • Load reduction goals greater than what is needed • Seasonal- 200 lb MOS • Annual- 480 lb MOS • MOS from non-point source control programs not incorporated into SWAT model • Implementation of Conservation Reserve Program (CRP) • Barnyard BMP implementation- barnyard runoff not incorporated into the model
Implementation • Utilize preexisting programs • Federal, state, and county • Use existing employees • Funding from public and private investors • Public includes: WDNR, Mead Lake District, Clark County Land Conservation Department • Additional BMP funding available • Volunteer water quality monitors
Suggested Further Treatment Methods • Three methods for reducing internal P loading • Alum Treatment: • Treat lake bottom before going anoxic and releasing P • Floc generation leads to P binding and becoming unavailable for plant uptake (aluminum phosphate) • Only administered after external loading controlled • External P would cover alum bed
Suggested Further Treatment Methods • Aeration • Prevent stratification and anoxic layer • Lines placed in deep holes to bubble air • Operation costs may be high due to electricity demands • Siphoning • Siphoning water from bottom before going anoxic • Where does it go? • Dry years may not have enough flow
Continued Monitoring • Data collection to begin 5 years after implementation • Water quality monitored for 2 years at South Fork Eau Claire River • Lake water quality data collected • Assume same time period? • Update land use data • Run updated SWAT and BATHTUB • Expensive
Critique of TMDL • No set 303(d) standards for WI • Advantage • Each lake will have unique characteristics • No standard allows for tailored goal based on feasibility • Disadvantage • Difficult comparison between lakes • No “blue print” for TMDL • More analysis required to develop specific goal
Critique of TMDL • Not including barnyard runoff in SWAT • Runoff from livestock is a major source of phosphorus • Land use data from 74 farmers • Load allocation may be underestimated • No reason as to why it was omitted from SWAT • Assuming BMPs will be enough to address MOS • MOS may be off due to barnyard runoff exclusion • Only 10 months of bi-weekly water quality data for calibration • Is this data really representative of average loads?
Summary • Will also decrease pH and algal blooms significantly • Seasonal loads have the most impact, but including annual load capacity will address all time periods • Inclusion of barnyard runoff into SWAT would have better represented load reduction results. • As of 2008, TMDL approved.