Download
1 / 1
10 likes | 134 Views
Sustained Ocean O bservations in Support of Sea S urface Salinity P rocess S tudies Gustavo Jorge Goni Gustavo.Goni@noaa.gov National Oceanic and Atmospheric Administration (NOAA), Atlantic Oceanographic and Meteorological Laboratory (AOML) Miami, Florida, USA.

E N D
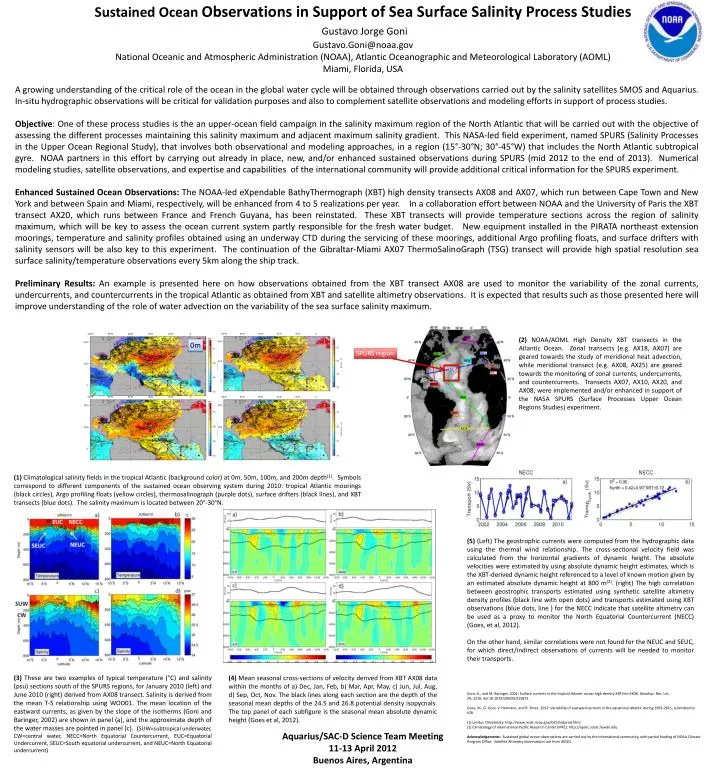
Sustained Ocean Observations in Support of Sea Surface Salinity Process Studies Gustavo Jorge Goni Gustavo.Goni@noaa.gov National Oceanic and Atmospheric Administration (NOAA), Atlantic Oceanographic and Meteorological Laboratory (AOML) Miami, Florida, USA A growing understanding of the critical role of the ocean in the global water cycle will be obtained through observations carried out by the salinity satellites SMOS and Aquarius. In-situ hydrographic observations will be critical for validation purposes and also to complement satellite observations and modeling efforts in support of process studies. Objective: One of these process studies is the an upper-ocean field campaign in the salinity maximum region of the North Atlantic that will be carried out with the objective of assessing the different processes maintaining this salinity maximum and adjacent maximum salinity gradient. This NASA-led field experiment, named SPURS (Salinity Processes in the Upper Ocean Regional Study), that involves both observational and modeling approaches, in a region (15°-30°N; 30°-45°W) that includes the North Atlantic subtropical gyre. NOAA partners in this effort by carrying out already in place, new, and/or enhanced sustained observations during SPURS (mid 2012 to the end of 2013). Numerical modeling studies, satellite observations, and expertise and capabilities of the international community willprovide additional critical information for the SPURS experiment. Enhanced Sustained Ocean Observations: The NOAA-led eXpendable BathyThermograph (XBT) high density transects AX08 and AX07, which run between Cape Town and New York and between Spain and Miami, respectively, will be enhanced from 4 to 5 realizations per year. In a collaboration effort between NOAA and the University of Paris the XBT transect AX20, which runs between France and French Guyana, has been reinstated. These XBT transects will provide temperature sections across the region of salinity maximum, which will be key to assess the ocean current system partly responsible for the fresh water budget. New equipment installed in the PIRATA northeast extension moorings, temperature and salinity profiles obtained using an underway CTD during the servicing of these moorings, additional Argo profiling floats, and surface drifters with salinity sensors will be also key to this experiment. The continuation of the Gibraltar-Miami AX07 ThermoSalinoGraph (TSG) transect will provide high spatial resolution sea surface salinity/temperature observations every 5km along the ship track. Preliminary Results: An example is presented here on how observations obtained from the XBT transect AX08 are used to monitor the variability of the zonal currents, undercurrents, and countercurrents in the tropical Atlantic as obtained from XBT and satellite altimetry observations. It is expected that results such as those presented here willimprove understanding of the role of water advection on the variability of the sea surface salinity maximum. (2) NOAA/AOML High Density XBT transects in the Atlantic Ocean. Zonal transects (e.g. AX18, AX07) are geared towards the study of meridional heat advection, while meridional transect (e.g. AX08, AX25) are geared towards the monitoring of zonal currents, undercurrents, and countercurrents. Transects AX07, AX10, AX20, and AX08, were implemented and/or enhanced in support of the NASA SPURS (Surface Processes Upper Ocean Regions Studies) experiment. 0m SPURS region (1) Climatological salinity fields in the tropical Atlantic (background color) at 0m, 50m, 100m, and 200m depth(1). Symbols correspond to different components of the sustained ocean observing system during 2010: tropical Atlantic moorings (black circles), Argo profiling floats (yellow circles), thermosalinograph (purple dots), surface drifters (black lines), and XBT transects (blue dots). The salinity maximum is located between 20°-30°N. (5) (Left) The geostrophic currents were computed from the hydrographic data using the thermal wind relationship. The cross-sectional velocity field was calculated from the horizontal gradients of dynamic height. The absolute velocities were estimated by using absolute dynamic height estimates, which is the XBT-derived dynamic height referenced to a level of known motion given by an estimated absolute dynamic height at 800 m(2). (right) The high correlation between geostrophic transports estimated using synthetic satellite altimetry density profiles (black line with open dots) and transports estimated using XBT observations (blue dots, line ) for the NECC indicate that satellite altimetry can be used as a proxy to monitor the North Equatorial Countercurrent (NECC) (Goes, et al, 2012). On the other hand, similar correlations were not found for the NEUC and SEUC, for which direct/indirect observations of currents will be needed to monitor their transports. (3) These are two examples of typical temperature (°C) and salinity (psu) sections south of the SPURS regions, for January 2010 (left) and June 2010 (right) derived from AX08 transect. Salinity is derived from the mean T-S relationship using WOD01. The mean location of the eastward currents, as given by the slope of the isotherms (Goni and Baringer, 2002) are shown in panel (a), and the approximate depth of the water masses are pointed in panel (c). (SUW=subtropical underwater, CW=central water, NECC=North Equatorial Countercurrent, EUC=Equatorial Undercurrent, SEUC=South equatorial undercurrent, and NEUC=North Equatorial undercurrent) (4) Mean seasonal cross-sections of velocity derived from XBT AX08 data within the months of a) Dec, Jan, Feb, b) Mar, Apr, May, c) Jun, Jul, Aug, d) Sep, Oct, Nov. The black lines along each section are the depth of the seasonal mean depths of the 24.5 and 26.8 potential density isopycnals. The top panel of each subfigure is the seasonal mean absolute dynamic height (Goes et al, 2012). Goni, G., and M. Baringer, 2002: Surface currents in the tropical Atlantic across high density XBT line AX08, Geophys. Res. Let., 29, 2218, doi:10.1029/2002GL015873. Goes, M., G. Goni, V. Hormann, and R. Perez, 2012: Variability of eastward currents in the equatorial Atlantic during 1993-2011, submitted to JGR. (1) Levitus Climatoloty: http://www.nodc.noaa.gov/OC5/indprod.html (2) Climatology of International Pacific Research Center (IPRC): http://apdrc.soest.hawaii.edu. Acknowledgements: Sustained global ocean observations are carried out by the international community, with partial funding of NOAA Climate Program Office. Satellite Altimetry observations are from AVISO. Aquarius/SAC-D Science Team Meeting 11-13 April 2012 Buenos Aires, Argentina


![[ s p o o k s ]](https://cdn0.slideserve.com/1465039/slide1-dt.jpg)