Download
1 / 1
10 likes | 226 Views
PE Simulation. Glider Data. Acoustic Tomography with Mobile Receivers

E N D
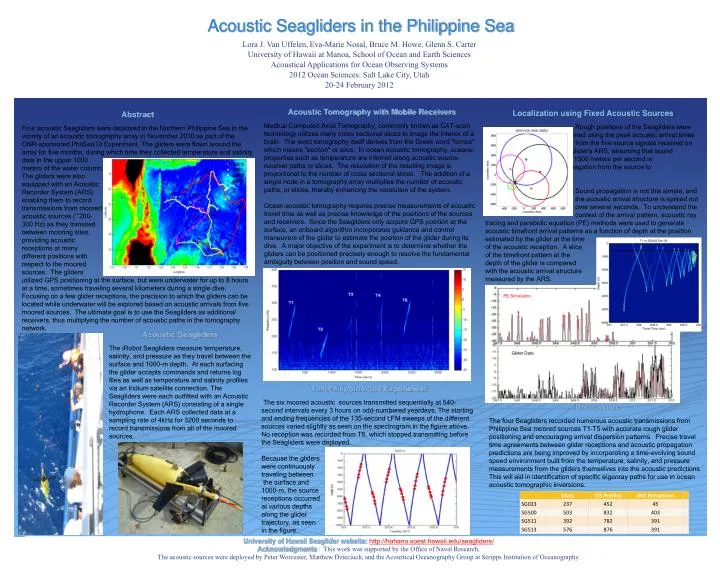
PE Simulation Glider Data Acoustic Tomography with Mobile Receivers Medical Computed Axial Tomography, commonly known as CAT-scan technology utilizes many cross sectional slices to image the interior of a brain. The word tomography itself derives from the Greek word "tomos" which means "section" or slice. In ocean acoustic tomography, oceanic properties such as temperature are inferred along acoustic source-receiver paths or slices. The resolution of the resulting image is proportional to the number of cross sectional slices. The addition of a single node in a tomography array multiplies the number of acoustic paths, or slices, thereby enhancing the resolution of the system. Ocean acoustic tomography requires precise measurements of acoustic travel time as well as precise knowledge of the positions of the sources and receivers. Since the Seagliders only acquire GPS position at the surface, an onboard algorithm incorporates guidance and control maneuvers of the glider to estimate the position of the glider during its dive. A major objective of the experiment is to determine whether the gliders can be positioned precisely enough to resolve the fundamental ambiguity between position and sound speed. Localization using Fixed Acoustic Sources Rough positions of the Seagliders were obtained using the peak acoustic arrival times from the five source signals received on the glider’s ARS, assuming that sound travels at 1500 meters per second in direct-line propagation from the source to the receiver. Sound propagation is not this simple, and the acoustic arrival structure is spread out over several seconds. To understand the context of the arrival pattern, acoustic ray tracing and parabolic equation (PE) methods were used to generate acoustic timefront arrival patterns as a function of depth at the position estimated by the glider at the time of the acoustic reception. A slice of the timefront pattern at the depth of the glider is compared with the acoustic arrival structure measured by the ARS. Abstract Four acoustic Seagliders were deployed in the Northern Philippine Sea in the vicinity of an acoustic tomography array in November 2010 as part of the ONR-sponsored PhilSea10 Experiment. The gliders were flown around the array for five months, during which time they collected temperature and salinity data in the upper 1000 meters of the water column. The gliders were also equipped with an Acoustic Recorder System (ARS) enabling them to record transmissions from moored acoustic sources (~200- 300 Hz) as they transited between mooring sites, providing acoustic receptions at many different positions with respect to the moored sources. The gliders utilized GPS positioning at the surface, but were underwater for up to 8 hours at a time, sometimes traveling several kilometers during a single dive. Focusing on a few glider receptions, the precision to which the gliders can be located while underwater will be explored based on acoustic arrivals from five moored sources. The ultimate goal is to use the Seagliders as additional receivers, thus multiplying the number of acoustic paths in the tomography network. Acoustic Seagliders in the Philippine Sea Lora J. Van Uffelen,Eva-Marie Nosal, Bruce M. Howe, Glenn S. Carter University of Hawaii at Manoa, School of Ocean and Earth Sciences Acoustical Applications for Ocean Observing Systems 2012 Ocean Sciences: Salt Lake City, Utah 20-24 February 2012 Acoustic Seagliders The iRobot Seagliders measure temperature, salinity, and pressure as they travel between the surface and 1000-m depth. At each surfacing the glider accepts commands and returns log files as well as temperature and salinity profiles via an Iridium satellite connection. The Seagliders were each outfitted with an Acoustic Recorder System (ARS) consisting of a single hydrophone. Each ARS collected data at a sampling rate of 4kHz for 3200 seconds to record transmissions from all of the moored sources. The Philippine Sea Experiment The six moored acoustic sources transmitted sequentially at 540-second intervals every 3 hours on odd-numbered yeardays. The starting and ending frequencies of the 135-second LFM sweeps of the different sources varied slightly as seen on the spectrogram in the figure above. No reception was recorded from T6, which stopped transmitting before the Seagliders were deployed. Because the gliders were continuously traveling between the surface and 1000-m, the source receptions occurred at various depths along the glider trajectory, as seen in the figure. Discussion The four Seagliders recorded numerous acoustic transmissions from Philippine Sea moored sources T1-T5 with accurate rough glider positioning and encouraging arrival dispersion patterns. Precise travel time agreements between glider receptions and acoustic propagation predictions are being improved by incorporating a time-evolving sound speed environment built from the temperature, salinity, and pressure measurements from the gliders themselves into the acoustic predictions. This will aid in identification of specific eigenray paths for use in ocean acoustic tomographic inversions. University of Hawaii Seaglider website: http://hahana.soest.hawaii.edu/seagliders/ Acknowledgments : This work was supported by the Office of Naval Research. The acoustic sources were deployed by Peter Worcester, Matthew Dzieciuch, and the Acoustical Oceanography Group at Scripps Institution of Oceanography.