Download
1 / 90
910 likes | 1.06k Views
A Comprehensive Study of Cool Season Tornadoes in the Southeast United States. Alicia C. Wasula July 13, 2005. Committee Members. Lance Bosart John Molinari Dan Keyser Chris Thorncroft Russ Schneider Morris Weisman. The Problem.

E N D
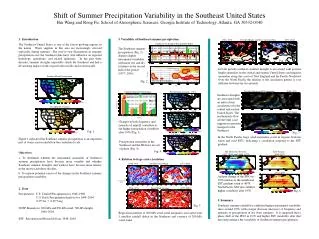
A Comprehensive Study of Cool Season Tornadoes in the Southeast United States Alicia C. Wasula July 13, 2005
Committee Members • Lance Bosart • John Molinari • Dan Keyser • Chris Thorncroft • Russ Schneider • Morris Weisman
The Problem • Nocturnal peak in tornado occurrence during cool season along Gulf coast • Difficulty warning public increased injury and loss of life (e.g., Fike 1993) • Difficult to discriminate between true threats and null events in real time
Goals • Provide evidence that this phenomenon exists • Provide possible physical explanations via: • Climatological analysis of low-level winds • Composite analysis of southeast US tornado episodes • Case study: 22-23 February 1998 • Relate results to tornadogenesis mechanisms
Outline • Historical Background • Review of low-level mesocyclone-genesis mechanisms • Climatology • Composite results • Case Study: 22-23 February 1998 • Conclusions • Future Work
Background • Cool season nocturnal tornado peak exists along Gulf coast (e.g. Knupp and Garinger 1993, Brooks et al. 2003) • Peak exists during early morning hours ~ 1200 UTC • Can occur in low CAPE/high shear environments • Return Flow air trajectory effects PBL thermodynamics
Background • Cool season nocturnal tornado peak exists along Gulf coast (e.g. Knupp and Garinger 1993, Brooks et al. 2003) • Can occur in low CAPE/high shear environments • Return Flow air trajectory effects PBL thermodynamics
CAPE vs. Shear for Cold Season Tornado Cases 0-2 km positive mean shear (x 10-3 s-1) Convective Available Potential Energy (CAPE, J/kg) Johns et al. 1993
Background • Cool season nocturnal tornado peak exists along Gulf coast (e.g. Knupp and Garinger 1993, Brooks et al. 2003) • Can occur in low CAPE/high shear environments • Return Flow air trajectory effects PBL thermodynamics
Previous Composite Study: Peninsular Florida Tornado Environments (Hagemeyer and Schmocker 1991) Dry season w’ = ~5°C Wet season w’ = ~1°C Wet Season Dry Season All non-TC tornadoes ± 2 h of 00/12Z 1980-1988 1) Thermodynamics w
Previous Composite Study: Peninsular Florida Tornado Environments (Hagemeyer and Schmocker 1991) Wet Season Dry Season All non-TC tornadoes ± 2 h of 00/12Z 1980-1988 2) Shear u v
Question #1: How does buoyancy/shear relationship effect convective mode?
Relationship of Buoyancy/Shear to Convective Mode CAPE (J/kg) Shear (m/s) Ordinary Multicell Supercell
Question #2: Given that shear is sufficient for supercells, how does hodograph shape determine supercell type?
Straight Hodograph Left & right mover equally dominant Left mover faster Source: A Convective Storm Matrix http://meted.ucar.edu/convectn/csmatrix/
Clockwise ¼ turn Hodograph Right mover dominant Left mover dissipates Source: A Convective Storm Matrix http://meted.ucar.edu/convectn/csmatrix/
Counterclockwise ¼ turn Hodograph Left mover dominant Right mover dissipates Source: A Convective Storm Matrix http://meted.ucar.edu/convectn/csmatrix/
Question #3:How does near-surface hodograph shape effect low-level mesocyclone generation?
Source of low-level rotation: baroclinic generation of horizontal vorticity in FFDstretched in updraft FFD Source: A Convective Storm Matrix http://meted.ucar.edu/convectn/csmatrix/
Streamwise Vorticity • Maximized when vorticity vector and velocity vector are parallel • 0 when vorticity vector and velocity vector are perpendicular
Wicker (1996) Horizontal Vorticity Vector (H) Storm Motion Vector
Wicker (1996) Vertical Velocity and Horizontal Winds At 50 m, 110 min Storm Inflow Environmental Winds
Wicker (1996) Pert. Temperature and Horizontal Vorticity At 50 m, 110 min FFD H adds to env. H H Parallel to inflow at FFD • Large streamwise vorticity X Updraft
Previous work has shown that supercells interacting with boundaries can produce long-lived tornadoes e.g., Maddox et al. 1980, Markowski et al. 1998, Rasmussen et al. 2000
Maddox et al. 1980 Along outflow boundary (C), streamwise vorticity is maximized
Tornado Climatology Southeast US Domain
Storm Data • Tornado Database 1950-2001 • Corrected for duplicate reports • Use only F2 or greater tornadoes for climatology • All tornadoes considered for composites • Cool season tornadoes (November – March)
By month By Hour (UTC)
1000 m Wind Climatology Pilot Balloon Stations
Pilot Ballon (Pibal) Dataset • 1948-1957 • 4x/day (0300, 0900, 1500, and 2100 UTC) • Wind data for lowest ~ 3 km • No thermodynamic data • No winds above cloud base
Surface Wind Climatology Surface Stations
Surface Observations • Locally archived at University at Albany • Hourly • Cool seasons 1995-96 to 1999-2000 • Subset of stations for which dataset is complete
Sample Windroses Coastal Station Inland Station
Hypothesis • More cooling / higher pressures over land at night • Less cooling / lower pressures over ocean at night • Easterly geostrophic component at surface
MORE COOLING AT NIGHT H Vg LAND OCEAN LESS COOLING AT NIGHT L
Eta NARR Dataset • 32 km reanalysis • November – March 1999-2000 • 0900-2100 UTC sea level pressure difference
Summary: Climatology • Cool season tornado peak in southeast US • Nocturnal maximum is strongest near Gulf of Mexico coast • 1000 m nocturnal LLJ is strongest near Gulf coast • Surface winds along coastline back at night due to more (less) cooling over land (water)
Tornado Episode Composites • NCEP/NCAR 2.5x 2.5 Reanalysis dataset • All tornado episodes 1950-2001 • ‘Episode-relative’ composite • Grouped by start time: 0000-0600, 0600-1200, 1200-1800, 1800-0000 UTC • Will show only TWO: • DAY: 1800-0000 UTC (n=327) • NIGHT: 0600-1200 UTC (n=130)
DAY NIGHT 200 hPa height (m), isotachs (m s-1)