Download
1 / 27
280 likes | 297 Views
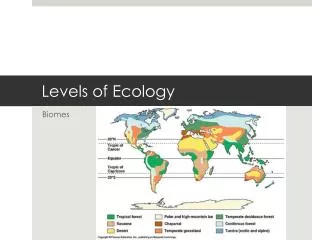
Ecology is studied at several levels. Ecology and evolution are tightly intertwined Biosphere = the total living things on Earth and the areas they inhabit Ecosystem = communities and the nonliving material and forces they interact with

E N D
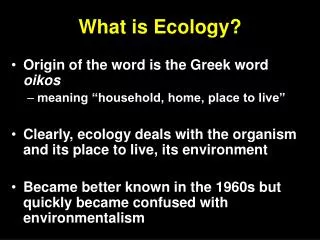
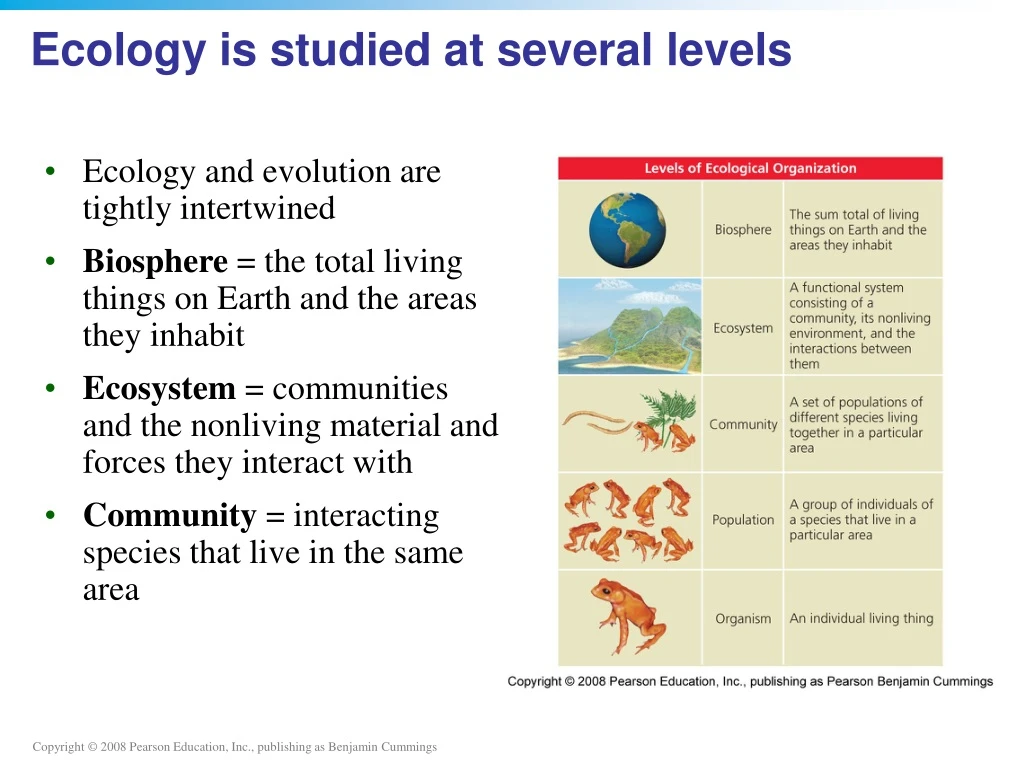
Ecology is studied at several levels • Ecology and evolution are tightly intertwined • Biosphere = the total living things on Earth and the areas they inhabit • Ecosystem = communities and the nonliving material and forces they interactwith • Community = interacting species that live in the same area
Levels of ecological organization • Population ecology = investigates the quantitative dynamics of how individuals within a species interact • Community ecology = focuses on interactions among species • Ecosystem ecology = studies living and nonliving components of systems to reveal patterns • Nutrient and energy flows
Organismal ecology: habitat • Habitat = the environment in which an organism lives • Includes living and nonliving elements • Scale-dependent: from square meters to miles • Habitat use = each organism thrives in certain habitats, but not in others • Habitat selection = the process by which organisms actively select habitats in which to live • Availability and quality of habitat are crucial to an organism’s well-being • Human developments conflict with this process
Organismal ecology: niche • Niche = an organism’s use of resources and its functional role in a community • Habitat use, food selection, role in energy and nutrient flow • Interactions with other individuals • Specialists = species with narrow niches and very specific requirements • Extremely good at what they do, but vulnerable to change • Generalists = species with broad niches that can use a wide array of habitats and resources • Able to live in many different places
Population characteristics • All populations show characteristics that help scientists predict their future dynamics • Population size = the number of individual organisms present at a given time • Numbers can increase, decrease, cycle or remain the same
Population characteristics • Population density = the number of individuals within a population per unit area • High densities make it easier to find mates, but increase competition, and vulnerability to predation • Low densities make it harder to find mates, but individuals enjoy plentiful resources and space
Population characteristics • Population distribution (dispersion) = spatial arrangement of organisms within an area • Random – haphazardly located individuals, with no pattern • Uniform – individuals are evenly spaced due to territoriality • Clumped – arranged according to availability of resources • Most common in nature
Sex ratio = proportion of males to females In monogamous species, a 50/50 sex ratio maximizes population growth Age Structure = the relative numbers of organisms of each age within a population Age structure diagrams (pyramids) = show the age structure of populations Population characteristics
Birth and death rates Crude birth/death rates = rates per 1000 individuals Survivorship curves = the likelihood of death varies with age Type I: More deaths at older ages Type II: Equal number of deaths at all ages Type III: More deaths at young ages
Four factors of population change Natality = births within the population Mortality = deaths within the population Immigration = arrival of individuals from outside the population Emigration = departure of individuals from the population Growth rate formula = (Crude birth rate + immigration rate) - (Crude death rate + emigration rate) = Growth rate
Limiting factors restrain growth Limiting factors = physical, chemical and biological characteristics that restrain population growth Water, space, food, predators, and disease Environmental resistance = All limiting factors taken together
Carrying capacity Carrying capacity = the maximum population size of a species that its environment can sustain An S-shaped logistic growth curve Limiting factors slow and stop exponential growth Carrying capacity changes Humans have raised their carrying capacity by decreasing the carrying capacity for other species
Population density affects limiting factors Density-dependent factors = limiting factors whose influence is affected by population density Increased risk of predation and competition for mates occurs with increased density Density-independent factors = limiting factors whose influence is not affected by population density Events such as floods, fires, and landslides
Biotic potential and reproductive strategies vary Biotic potential = the ability of an organism to produce offspring K-selected species = animals with long gestation periods and few offspring Have a low biotic potential Stabilize at or near carrying capacity Good competitors r-selected species = animals which reproduce quickly Have a high biotic potential Little parental care
Population changes affect communities As population in one species declines, other species may appear Human development now displaces other species and threatens biodiversity As Monteverde dried out, species from lower, drier habitats appeared But, species from the cloud-forest habitats disappeared
Challenges to protecting biodiversity Social and economic factors affect species and communities Nature is viewed as an obstacle to development Nature is viewed as only a source of resources Human population growth pressures biodiversity
Preserving biodiversity • Natural parks and protected areas help preserve biodiversity • Often, they are underfunded • Ecotourism brings jobs and money to developing areas
QUESTION: Review Biological diversity includes all of the following, except: a) Species diversity b) Genetic diversity c) Population diversity d) Community diversity e) All of these are included in the concept of biodiversity
QUESTION: Review Which of these species is least vulnerable to extinction? a) A species with a population size of 50 individuals b) A species distributed throughout the United States c) A species that eats only river snails d)A species that lives on mountaintops
QUESTION: Review An ecosystem is defined as: a) The total living things on Earth b) Members of the same population that can interbreed c) Interacting species in an area d) Species and the nonliving material they interact with
QUESTION: Viewpoints Should we care whether a species goes extinct? • Yes, because all life is important and valuable • Yes, because we are causing this wave of extinction, so we should fix it • We should not, because it’s natural • I don’t care; it really does not affect me
QUESTION: Viewpoints Do you think humans are subject to limiting factors and, ultimately, a fixed carrying capacity? • Yes, although we have raised the carrying capacity, there are limits to the number of humans the Earth can support • Yes, but technology will keep raising the carrying capacity, so it’s not much of a problem • No, humans are no longer constrained by environmental limits, due to our technology and ability to manipulate the environment • I don’t care; it really does not affect me
QUESTION: Interpreting Graphs and Data Which of the following graphs shows a population that will have fewer individuals in the future? (a) (b) (c) (d)
QUESTION: Interpreting Graphs and Data Which type of distribution is a result of individuals guarding their territory? a) Random b) Uniform c) Clumped d) None of these
QUESTION: Interpreting Graphs and Data What does this graph show? a) The effects of carrying capacity on population growth b) A population that keeps growing c) The effects of exponential growth d) The effects of increasing carrying capacity