Download
1 / 17
170 likes | 322 Views
Day Three: Regional Resiliency & Health Challenges in the Aftermath of Nuclear Terrorism Modeling of Evacuation Destinations. Spontaneous Evacuation. Evacuation should not be conceptualized as the government bringing in buses and taking people to shelters

E N D
Day Three: Regional Resiliency & Health Challenges in the Aftermath of Nuclear Terrorism Modeling of Evacuation Destinations
Spontaneous Evacuation Evacuation should not be conceptualized as the government bringing in buses and taking people to shelters Rather, the vast majority of people evacuate on their own, in their own vehicles Where do they go? What are the implications for reception communities? 2
Three Mile Island - March 28, 1979 Only 3,500 should have left…144,000 people within a 15 mile radius of the plant evacuated (evacuation shadow) Median evacuation response: 85mi (137km), 100 mi (161km), 111 mi (180km) (depending on study cited) Virtually none went to Hershey shelter 3
Evacuation Planning Tool: Purpose The objective of this project was to develop a map-based tool to predict community population surge following potential urban disasters. The final product was designed as a planning tool for preparedness planners, and as an educational tool to inform policy makers about the issue of population surge resulting from urban evacuation. The tool includes information on the number of likely evacuees, evacuee demographic information (such as presence of children, disability status, etc.), and local planning information.
How the tool works – 3 types of variables • Scenario Specific Variables: • Based on the nature of the precipitating event – how much “push” does it have, and how many urban citizens are likely to evacuate as a result? • Original scenarios: dirty bomb, pandemic flu, industrial/chemical • Demographics Variables: • Based on the demographics of the urban area, who is more or less likely to evacuate? For example, people with children are more likely to evacuate; people with disabilities are less likely to evacuate, etc. • Pull Variables: • Based on known information about counties surrounding the urban area, which will be more or less attractive to evacuees? Features that make a county more attractive include things such as road networks into the county, number of hotel rooms and second homes, family networks, etc.
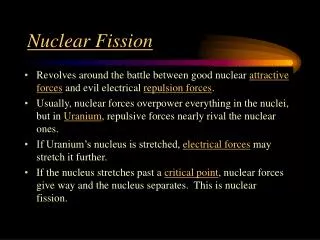
IND Scenario Modifications • Modify Dirty Bomb scenario to 10 Kiloton Detonation • Revise center city population at time of impact to include commuters (+ 1.48 mil) and tourists (+ 910,000) • Subtract Manhattan commuters from surrounding counties • Decrease proportion of Manhattan evacuees assuming injuries and fatalities (from 65% to 40%)
IND Scenario Modifications • Modify Dirty Bomb scenario to 10 Kiloton Detonation (continued) • “Turn off” immediately surrounding counties as evacuation destinations/increase evacuation zone (set counties within 10 km at 80% evacuation; 10 to 20 km at 60% evacuation) • Manually cut Long Island “pull” by 75% and redistribute evacuees • Decrease numbers of evacuees remaining within 150 mile radius on the assumption that people will evacuate farther (from 52% to 40%); 50 mile radius from 25% to 13%; 50 to 150 stays at 27%
Rural Preparedness Planning Guide Panel findings synthesized into set of guidelines Intended audience: rural preparedness planners (local health depts., emergency managers, etc.) Implications for Rural Preparedness Planning
Questions Please contact: Michael Meit, MA, MPH Co-Director Walsh Center for Rural Health Analysis NORC at the University of Chicago 4350 East West Hwy, Suite 800 Bethesda, MD 20814 PH: 301-634-9324 Fax: 301-634-9301 Email: meit-michael@norc.org