Download
1 / 15
150 likes | 287 Views
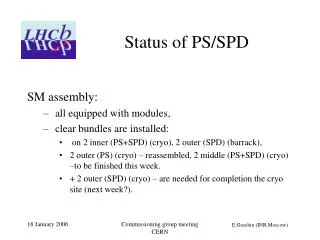
Wirescans in PS (all batches at extraction) and SPS at extraction. PS: average emittance ε y,n =1.45μm SPS: average Q20 optics ε y,n =1.45μm SPS: average Q26 optics ε y,n =1.40μm Smallest emittance in SPS: 1μm !?! To be investigated …. BWS Error Sources. Q20 data analysis.

E N D
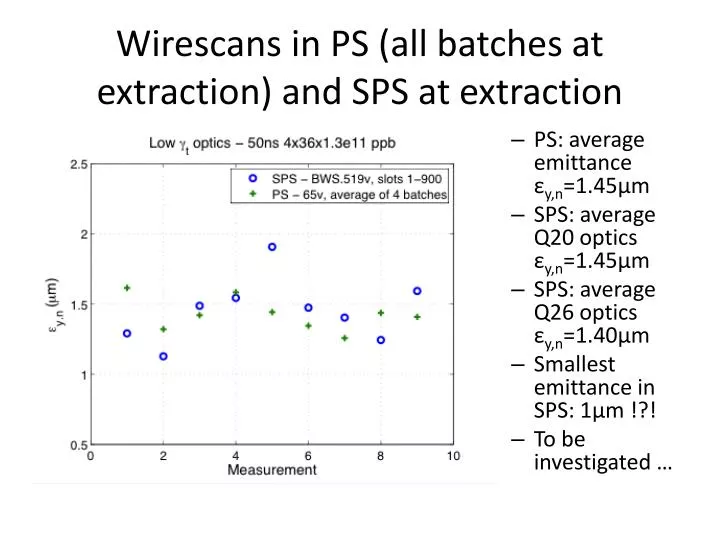
Wirescans in PS (all batches at extraction) and SPS at extraction • PS: average emittanceεy,n=1.45μm • SPS: average Q20 optics εy,n=1.45μm • SPS: average Q26 optics εy,n=1.40μm • Smallest emittance in SPS: 1μm !?! • To be investigated …
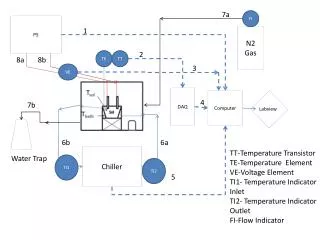
Q20 data analysis • Profile data extracted from the Logging DB (corresponding to ~1h) • Offline computation of emittaces • Second emittance computation with N sigma profile points • PS: signal to noise ratio not optimal • SPS: slight sign of PM saturation PS SPS
Emittance from 20 sigma profile Ε(um) t(ns) LHCFAST3 cycle timestamp SPS Full profile Gaussian fit PS Full profile Gaussian fit SPS 20 sigma Gaussian fit PS 20 sigma Gaussian fit
Emittance from 20 sigma profile Ε(um) t(ns) LHCFAST3 cycle timestamp SPS Full profile Gaussian fit PS Full profile Gaussian fit SPS 20 sigma Gaussian fit PS 20 sigma Gaussian fit
Residuals A(mA) A(mV) Pos(um) Pos(um) A(mV) A(mA) Pos(um) Pos(um) Acquired profiles
Residuals A(mV) A(mA) Pos(um) Pos(um) A(mA) A(mV) Pos(um) Pos(um) Acquired profiles
Residuals A(mA) Pos(um) Pos(um) A(mA) Pos(um) Pos(um) Acquired profiles
Emittance from 2 sigma profile Ε(um) t(ns) LHCFAST3 cycle timestamp SPS Full profile Gaussian fit PS Full profile Gaussian fit SPS 2 sigma Gaussian fit PS 2 sigma Gaussian fit
Residuals A(mA) A(mV) Pos(um) Pos(um) A(mV) A(mA) 120um Pos(um) Pos(um) Calibration table needs to be recomputed Acquired profiles
Residuals A(mA) A(mV) Pos(um) Pos(um) A(mV) A(mA) Pos(um) Pos(um) Acquired profiles
Conclusions • Most of the measurements are within the expected error (Eerror=2 Sigmaerror) • There are some obviously wrong measurements: • WS error in the measurement • Another source ?(human, beam, timing…) But the tendency agrees. • We can change the average result already in a 20% percent just by using different amount of data -> We need to define precisely what do we call ‘size of the beam’: • Which profile do we use to compute sigma? • How do we compute sigma? • Apply the same everywhere • Try to define error bars: In this particular case in the SPS we try to measure sizes of ~350um and the potentiometer resolution is ~200um (in fact ~120um around a centered beam so we have ~ 3 points per sigma)
FIT Thesis: Federico Roncarolo Wire sanner at the BOOSTER, PS and SPS, B.Dehning
Conclusions • Most of the measurements are within the expected error (Eerror=2 Sigmaerror) • There are some obviously wrong measurements: • WS error in the measurement • Another source ?(human, beam, timing…) But the tendency agrees. • We can change the average result already in a 20% percent just by using different amount of data -> We need to define precisely what do we call ‘size of the beam’: • Which profile do we use to compute sigma? • How do we compute sigma? • Apply the same everywhere • Try to define error bars: In this particular case in the SPS we try to measure sizes of ~350um and the potentiometer resolution is ~200um (in fact ~120um around a centered beam so we have ~ 3 points per sigma) • The sources of errors attached to this instrument are quite numerous and varied. If we want to withdraw conclusions, take decisions with respect to these kind of measurements we need to build up enough statistics and: • The WS is an instrument not easy to set up. Take time to find best measurements conditions. • Try to use several. • Offline analysis needed: logging of other variables, beta, intensity, dp/p, emittance from op. app.