Download
1 / 16
160 likes | 333 Views
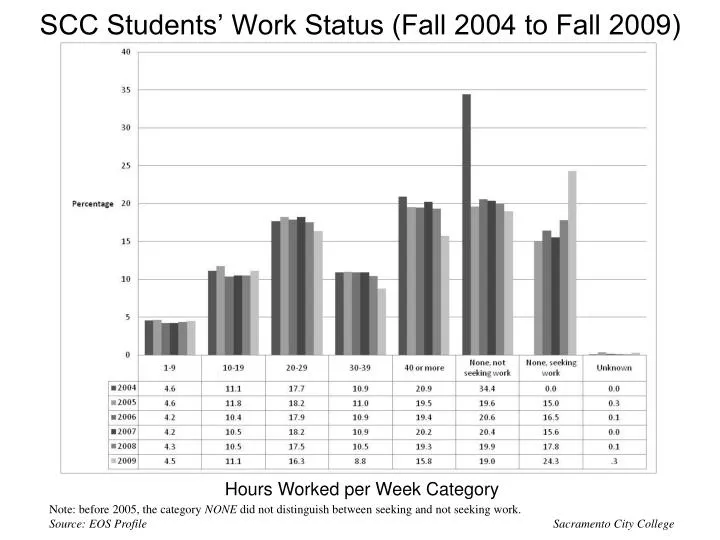
SCC Students’ Work Status (Fall 2004 to Fall 2009). - -. Hours Worked per Week Category. Note: before 2005, the category NONE did not distinguish between seeking and not seeking work. Source: EOS Profile Sacramento City College. SCC Gender Distribution (Fall 2004 to Fall 2009).

E N D
SCC Students’ Work Status (Fall 2004 to Fall 2009) - - Hours Worked per Week Category Note: before 2005, the category NONE did not distinguish between seeking and not seeking work. Source: EOS ProfileSacramento City College
SCC Gender Distribution (Fall 2004 to Fall 2009) Source: End of Semester Profile
SCC Age Group Distribution (Fall 2004 to Fall 2009) 2009 Percentages Source: End of Semester Profile
SCC Student Ethnicity Profile (Fall 2004 to Fall 2009) Source: End of Semester Profile
SCC Student Household Income Level (Fall 2004 to Fall 2009) 2009 Percentages: Note: This measure uses U.S. Department of Health and Human Services definitions for income levels. Source: End of Semester Profile
SCC Students’ Educational Goal Distribution(Fall 2004 to Fall 2009) * 4-year students meeting 4-year requirements (new category for 2007) Source: End of Semester Profile
SCC College Students, by First Generation Status (Fall 2005 to Fall 2009) 2009 Percentages Source: End of Semester Profile
SCC Students’ Primary Languages (Fall 2004 to Fall 2009) 2009 Percentages Source: End of Semester Profile
SCC Students by Enrollment Status, Fall 2004 to Fall 2009 Source: End of Semester Profile
SCC Students, by Education Initiative Status (Fall 2004 to Fall 2009) Source: EOS Profile
Student Load SCC Student Load Fall 2004 to 2009 Students Source: EOS Profile Sacramento City College
Student Load SCC Student Load (%) Fall 2004 to 2009 Percentage** **may not add to 100% due to unknowns. Source: EOS Profile Sacramento City College
SCC Enrollment of Recent High School Graduates Fall 2005-2009 Top 10 Feeder High Schools Number of Students Source: LRCCD IR Report Card and EOS Profile * New area high school, no HS graduates for that year.
Public High School Participation Rates Fall 2004 to 2008 NEEDS 2009 – Data expected July 2010 Percent of Public High School Graduating Class Attending SCC the Following Fall Top 9 Feeder Schools for Most Recent Year (2008) For the most recent year, 2008, the top 9 feeder schools represent 42% of total enrollment of recent high school graduates attending Sacramento City College • No HS graduate data for that year. Source: LRCCD IR Report Card (EOS Profile and CBEDS data) Sacramento City College
SCC Recent High School Graduates’ Ethnicity Profile (Fall 2005 to Fall 2009) Source: EOS Profile
SCC Student Home Zip Codes SCC Student Home Zip Codes This Slide uses the Fact Book Slide # 2-6 Sources: Enrollment - EOS Research Database Files Metropolitan Statistical Area (MSA) Zips – U.S. Census Sacramento City College 2-6