Download
1 / 22
220 likes | 371 Views
Characterization of the Engineering Test Reactor at the INL for Final Disposition. TRTR 2007. J. R. Parry Irradiation Test Programs INL. Contents. Reactor Description Initial Characterization Focus Areas Refined Characterization Results Disposition Progress. Reactor Description.

E N D
Characterization of the Engineering Test Reactor at the INL for Final Disposition TRTR 2007 J. R. Parry Irradiation Test Programs INL
Contents • Reactor Description • Initial Characterization • Focus Areas • Refined Characterization • Results • Disposition Progress
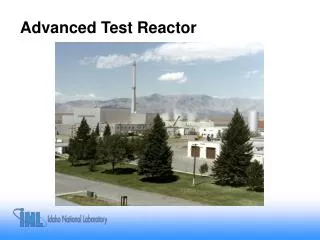
Reactor Description • The ETR core was 36 inches high by 30 inches square • The core was surrounded on 4 sides by a beryllium reflector 4.5 inches thick. • Fuel elements consisted of 19 flat fuel plates of aluminide fuel enriched to 93% U-235 • 17 loop positions and many capsule positions. • An aluminum reflector surrounded the Be reflector and extended to the inner tank wall.
Reactor Description continued • 16 control rods were used in the ETR • 8 black (safety) rods used only for startup and shutdown • 8 grey rods used for power level control • Control rods had fuel followers consisting of 16 plate fuel elements. • Magnetite concrete was used as a biological shield around the core.
Characterization for Disposal • 2004 characterization effort to determine options for the disposal of the ETR. • Out of vessel area characterization was based on radiological surveys. • In-core characterization was based on computer modeling.
Computer Modeling • MCNP was used to model the ETR reactor: • Determined the neutron flux for various components in and the biological shielding. • ORIGEN2 was used to determine the activation product inventory: • Used the cross section library typically used for ATR calculations.
MCNP Model Biological Shield External Thermal Shield and Small Pressure Vessel Internal Thermal Shields Aluminum Reflector Beryllium Reflector
MCNP Model Aluminum Fillers or Capsule Experiment Locations Control Rods Fuel Followers In-Pile Tubes
Focus Areas • From the 2004 characterization work, areas of concern for disposal were identified for detailed analysis: • Transuranic inventory in the beryllium reflector • Nb94 in the grid plate
Beryllium Sampling • Original beryllium impurity concentrations were unknown so sampling was performed: • Beryllium plug would not move so a sample was chiseled from the top of the plug. • Actinide concentrations were determined by SWRI. • Analysis used to determine the initial uranium concentration in the beryllium. • Assumed all transuranics originated from U-238. • Assumed all Cs-137 originated from U-235 fission.
Refined MCNP Beryllium Model • The MCNP model was refined to provide more detail in the reflector. • Plug sample location was modeled. • SLSF core was modeled. • Fuel loadings were adjusted to be more representative. • Each reflector wall was modeled separately. • Actinide cross sections were generated for ORIGEN2 at each reflector wall and the plug sample location
Improved MCNP Model SLSF Core Configuration
Scaling Factors • Use the modeling results to relate the sample results to the entire reflector. • Assume the difference in results at the sample location translates to the entire reflector. • Create scaling factors to scale the modeling results for the entire reflector.
Final Results • Initial characterization: • 2005 uranium concentration assumption: 30 ppm • 2005 characterization reults: 946 nCi/gm • Final characterization: • Initial uranium concentration: ≈7 ppm • Revised characterization: 177 nCi/gm