Download
1 / 40
770 likes | 1.2k Views
The Water-Energy-Food Nexus At the Top of the Global Agenda. Diana Glassman Board Member, World Policy Institute March 7, 2012. Agenda. Why so important? What is it? Call to action. 2. WHY SO IMPORTANT?. 3. Intensifying water scarcity. (3).

E N D
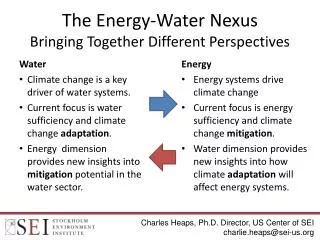
The Water-Energy-Food NexusAt the Top of the Global Agenda Diana Glassman Board Member, World Policy Institute March 7, 2012
Agenda Why so important? What is it? Call to action 2
Intensifying water scarcity (3) Declining water tables focus on consumption (as a start point) 4
Increasing strain – people and city growth World population growth 1950-2050 Trends in urbanization – urban population • (as a percentage of total population) • (in thousands) Source: UN via EBG Capital Source: UN via EBG Capital
Developed countries Developing countries – humid Developing countries – arid More shortages expected Freshwater is just a small part of global water resources Water shortage – per capita water availability • (per capita water availability compared with 1950) 100 80 60 40 20 0 1950 1960 1970 1980 1990 2000 2010 2020 2030 Source: WWAP, UN Global Environment Outlook via EBG Capital Source: World Bank via EBG Capital
At the top of the global agenda TODAY • Core global issue • Geo-politics, finance, • Pressing issues Water-Energy-Food Nexus 2007 • Global issue • CEO-level • Public attention Carbon Arab Spring “Food versus Fuel” Biofuels Hydraulic Fracing Energy Shortages (NE China, France) “Stress” Nexus ? Pre-2007 • Local attention • Tree huggers • Back office issue Environment as Compliance 8
Agriculture >80% of freshwater consumption (1) 100 billion gallons/day Livestock 3% Other 16% Irrigation 81% 10
Increasingly water-intensive food preferences Animal protein consumption (Calories per day) Source: FAO via EBG Capital 11
Energy a substantial amount of the rest Livestock 3% Irrigation 81% (1) 12
Increasing energy demand Global Energy Demand Growth by Region (1971-2030) Energy Demand (Mtoe) Notes: 1. OECD refers to North America, W. Europe, Japan, Korea, Australia and NZ 2. Transition Economies refers to FSU and Eastern European nations 3. Developing Countries is all other nations including China, India etc. Source: IEA World Energy Outlook 2006 via EBG Capital Confidential 15
Green electricity is not always blue The World Policy Institute-EBG Capital Air Conditioner Chart(1) An 18,000 BTU/hr air conditioner 12 hours/day for one week consumes: • Source: World Policy Institute-EBG Capital Analysis -- based on US Department of Energy 2006 and World Economic Forum; Cambridge Energy Research Associates 2009
Green transportation fuels are not always blue The World Policy Institute-EBG Capital Transportation Chart(2) Gallons of water consumed to produce the energy required to drive round-trip from New York City to Washington, D.C. (roughly 2 million BTUs) (2) Source: World Policy Institute-EBG Capital Analysis -- based on US Department of Energy 2006 and World Economic Forum; Cambridge Energy Research Associates 2009; and http://maps.google.com
Insights Water-energy-food inextricably linked Food = water Green does not always equal blue Integration, not isolation 19
Fiendishly complex – no easy answers Security food, military, energy Business opportunities, costs, risks Environment agriculture, forest, climate WATER Sustainable development sanitation, health, poverty, gender Justice pricing, ownership, equity FOOD ENERGY Policy Media 20
The opportunities Food waste -- storage, transportation, distribution Irrigation Energy efficiency Smart cities – majority of world’s population, food consumption and emissions
Cities are the key National, international sclerosis Get things done Local solutions to local problems Innovation Multi-stakeholder, multi-disciplinary (civil) discourse Dynamic petrie dishes 22
THANK YOU 23
APPENDIX 24
Sources • U.S. Department of Energy. “Energy Demands on Water Resources: Report to Congress on the Interdependency of Energy and Water.” last modified December 2006. Accessed March 1, 2011. http://www.sandia.gov/energy-water/docs/121-RptToCongress-EWwEIAcomments-FINAL.pdf • Shiklomanov, Igor A., State Hydrological Institute (SHI, St. Petersburg), and United Nations Educational, Scientific and Cultural Organization (UNESCO, Paris).1999; World Resources 2000-2001, People and Ecosystems: The Fraying Web of Life. World Resources Institute (WRI). Washington DC, 2000; Harrison, Paul and Fred Pearce, AAAS Atlas of Population 2001. American Association for the Advancement of Science, University of California Press, Berkeley. • Pimm, Stuart. “Atlas of Global Conservation Maps Human Impact on Planet.” NATGEO News Watch. April 21, 2010. Accessed March 1, 2011. http://blogs.nationalgeographic.com/blogs/news/chiefeditor/2010/04/atlas-of-global-conservation.html • World Policy Institute-EBG Capital Analysis -- based on US Department of Energy, 2006; World Economic Forum and Cambridge Energy Research Associates, 2009; http://maps.google.com • Michaels, Joelle Davis. Energy Information Administration : “What is a BTU?” Accessed March 1, 2011. http://www.eia.doe.gov/emeu/consumptionbriefs/cbecs/pbawebsite/office/office_refbtu.htm • EV World: “Energy note: Energy in natural processes and human consumption, some numbers.” Accessed March 1, 2011. http://www.evworld.com/library/energy_numbers.pdf • Cleveland, Cutler. The Encyclopedia of Earth: “Watt-hour.” Accessed March 1, 2011. http://www.eoearth.org/article/Watt-hour; http://www.ehow.com/facts_5029839_watt-power.html • World Policy Institute-EBG Capital Analysis -- based on US Department of Energy, 2006; World Economic Forum and Cambridge Energy Research Associates, 2009; http://en.wikipedia.org/wiki/Plasma_display 25
Water uses enormous amounts of energy Energy consumers Supply and conveyance Wastewater collection and treatment Treatment Distribution Wastewater discharge Some factoids Electricity = 75% of municipal water processing and distribution cost 4% of US power used for water supply and treatment (1) 26
Analytic framework Water impact analysis Quality Withdrawal Consumption Our focus 27
What are a million BTUs? British Thermal Unit (BTU): amount of heat energy needed to raise the temperature of one pound of water by one degree Farenheit New York to DC Sao Paulo to Rio de Janeiro Rome to Bologna 1 BTU (roughly, one matchstick) (4) 1 million BTUs (roughly, the energy required to drive 200 miles) (5) 29
Massive first-generation biofuels consumption Gallons consumed/million BTUs 79 44,500 Biofuels – soy (irrigated first-generation)* 4 15,750 Biofuels – corn (irrigated first-generation)* Oil sands -- SAGD (no data)** 13 Oil sands -- mining 260 Raw Avg 2 Unconventional natural gas (shale)*** 13 TransformAvg 2 Natural gas 0 13 Oil (traditional)**** 1 0 10,000 20,000 30,000 40,000 50,000 (4) *excludes non-irrigated (majority of soy and corn), second and third generation ag waste, cellulosic camelina, jatropha, algae, etc. **constitutes large part of future oil sands growth ***data captured before boom in hydraulic fracturing ****data excludes water flooding and EOR techniques incl C02 injection, etc. 30
Increasing petroleum water intensity Gallons consumed/million BTUs Oil sands -- SAGD (no data)** Oil sands -- mining 260 13 Unconventional natural gas (shale)*** Natural gas Raw Avg TransformAvg Oil (traditional)**** 13 1 (4) 0 50 100 150 200 250 300 **constitutes large part of future oil sands growth ***data captured before boom in hydraulic fracturing ****data excludes water flooding and EOR techniques incl C02 injection, etc. 31
Increasing natural gas intensity Gallons consumed/million BTUs Oil sands -- SAGD (no data) Oil sands -- mining Unconventional natural gas (shale) 2 13 Natural gas 2 Raw Avg 0 TransformAvg Oil (traditional) (4) 0 50 100 150 200 250 300 **constitutes large part of future oil sands growth ***data captured before boom in hydraulic fracturing ****data excludes water flooding and EOR techniques incl C02 injection, etc. 32
Emerging gas versus oil Gallons consumed/million BTUs Oil sands -- SAGD (no data)** Oil sands -- mining 260 13 Unconventional natural gas (shale)*** 2 13 Natural gas 2 0 Oil (traditional)**** 13 1 0 50 100 150 200 250 300 Raw Avg TransformAvg (4) **constitutes large part of future oil sands growth ***data captured before boom in hydraulic fracturing ****data excludes water flooding and EOR techniques incl C02 injection, etc. 33
ELECTRICITY 34
What is a MWh? 1 KWh = 1,000 Wh (10 100W light bulbs/hr) 1 MWh = 1,000 KWh = 1million Wh (roughly, plasma screen TV/yr) (6) (4, 6, 8) Watt: a standard unit of power that specifies the rate electrical energy is dispersed (7) Watt-hour (Wh): a measure of power over time (7) 35
Relatively tight range driven by cooling Gallons consumed/MWh Coal IGCC Wind Solar -- photovoltaic Solar – thermal* Run of the river Hydroelectric (2) Hydroelectric (1) Geothermal Raw 38 Thermoelectric (natural gas)** 180 Trans 38 Thermoelectric (oil)** 390 38 Thermoelectric (coal)** 390 Thermoelectric (nuclear)** 560 (8) 0 1,000 2,000 3,000 4,000 5,000 *installed base only **closed loop 36
“Cleaner” electricity consumption varies Gallons consumed/MWh Coal IGCC 200 0 Wind 0 Solar -- photovoltaic 835 Solar – thermal* 0 Run of the river Hydroelectric (2) 4,500 0 Hydroelectric (1) Geothermal 1,400 Raw 38 Thermoelectric (natural gas)** 180 Trans 38 Thermoelectric (oil)** 390 38 Thermoelectric (coal)** 390 Thermoelectric (nuclear)** 560 (8) 0 1,000 2,000 3,000 4,000 5,000 *installed base only **closed loop 37
General paucity of decision-making information -- therefore poor quality discussion Many issues with existing water-energy information: Lack of information Partial/incomplete information Frequently deep but narrow Inconsistent -- not “apples to apples” or comparable Inaccessible technical jargon Anecdotal Mis-characterized/mis-represented Inconsistent data interpretation – sometimes politicized 39
We seek to add water to the agenda by making information more transparent and accessible Our primary source: US Department of Energy. “Energy Demands on Water Resources: Report to Congress on the Interdependency of Energy and Water.” Last modified December 2006. Rationale – the most credible data available: Broad-ranging normalized comparables across energy production technologies Produced by 12 US National Labs Respected scientific authorship Repeatedly cited in subsequent research Relatively non-politicized Presented to US Congress – therefore influential Limitations – the underlying data are imperfect: Focuses on technologies that existed in 2006 – needs updating Has some data holes Leaves out emerging technologies 40