Download
1 / 1
10 likes | 230 Views
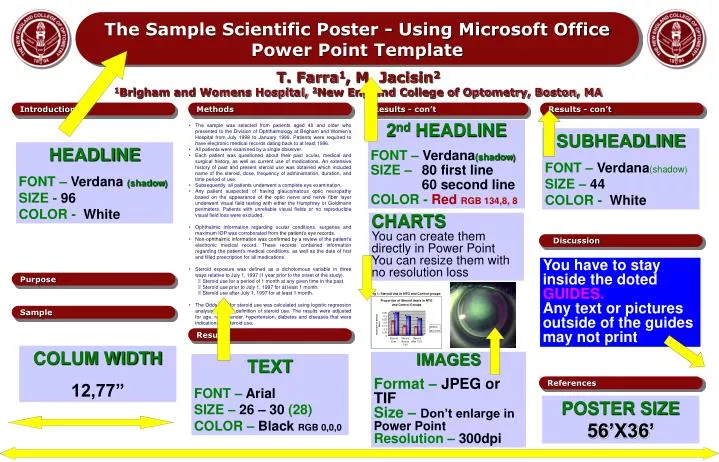
Fig 1: Steroid Use in NTG and Control groups. *. *. *. The Sample Scientific Poster - Using Microsoft Office Power Point Template. T. Farra 1 , M. Jacisin 2 1 Brigham and Womens Hospital, 2 New England College of Optometry, Boston, MA. Introduction. Methods. Results - con’t.

E N D
Fig 1: Steroid Use in NTG and Control groups * * * The Sample Scientific Poster - Using Microsoft Office Power Point Template T. Farra1, M. Jacisin21Brigham and Womens Hospital, 2New England College of Optometry, Boston, MA Introduction Methods Results - con’t Results - con’t • The sample was selected from patients aged 40 and older who presented to the Division of Ophthalmology at Brigham and Women’s Hospital from July 1998 to January 1999. Patients were required to have electronic medical records dating back to at least 1996. • All patients were examined by a single observer. • Each patient was questioned about their past ocular, medical and surgical history, as well as current use of medications. An extensive history of past and present steroid use was obtained which included name of the steroid, dose, frequency of administration, duration, and time period of use. • Subsequently, all patients underwent a complete eye examination. • Any patient suspected of having glaucomatous optic neuropathy based on the appearance of the optic nerve and nerve fiber layer underwent visual field testing with either the Humphrey or Goldmann perimeters. Patients with unreliable visual fields or no reproducible visual field loss were excluded. • Ophthalmic information regarding ocular conditions, surgeries and maximum IOP was corroborated from the patient’s eye records. • Non-ophthalmic information was confirmed by a review of the patient’s electronic medical record. These records contained information regarding the patient’s medical conditions, as well as the date of first and filled prescription for all medications. • Steroid exposure was defined as a dichotomous variable in three ways relative to July 1, 1997 (1 year prior to the onset of the study). • Steroid use for a period of 1 month at any given time in the past. • Steroid use prior to July 1, 1997 for at least 1 month. • Steroid use after July 1, 1997 for at least 1 month. • The Odds ratio for steroid use was calculated using logistic regression analysis for each definition of steroid use. The results were adjusted for age, race, gender, hypertension, diabetes and diseases that were indications for steroid use. 2nd HEADLINE FONT – Verdana(shadow) SIZE – 80 first line 60 second lineCOLOR -Red RGB 134,8, 8 SUBHEADLINE FONT – Verdana(shadow) SIZE – 44COLOR -White k HEADLINE FONT – Verdana(shadow)SIZE - 96 COLOR -White CHARTSYou can create them directly in Power PointYou can resize them with no resolution loss Discussion You have to stay inside the doted GUIDES.Any text or pictures outside of the guides may not print Purpose Sample Results COLUM WIDTH 12,77” IMAGES Format – JPEG or TIF Size – Don’t enlarge in Power PointResolution – 300dpi TEXT FONT – ArialSIZE – 26 – 30 (28)COLOR – Black RGB 0,0,0 References POSTER SIZE56’X36’