Download
1 / 24
240 likes | 395 Views
STATISTICS FOR BUSINESS. Chapter 13. Six-sigma management. Mars climate orbiter. STATISTICS FOR BUSINESS (Six-sigma management). Mars climate orbiter. Product and process design specification. PRODUCT (perhaps intangible a service product)

E N D
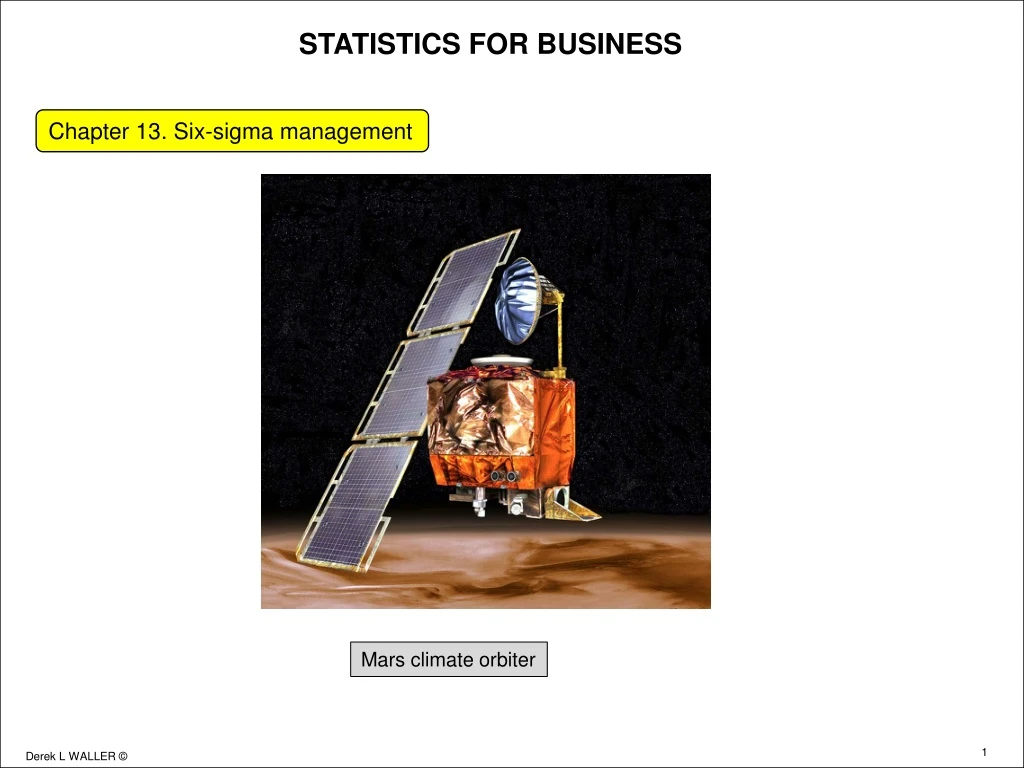
STATISTICS FOR BUSINESS Chapter 13. Six-sigma management Mars climate orbiter
STATISTICS FOR BUSINESS (Six-sigma management) Mars climate orbiter Product and process design specification PRODUCT (perhaps intangible a service product) Has design specifications Established by producing firm, customer, or both They are usually fixed PROCESS Makes the product or service: uses labor, machines, materials, equipment, and money Product and process Are two different entities. However: for a given system they are inseparable Process control chart is used to determine whether a process is in control
STATISTICS FOR BUSINESS (Six-sigma management) Statistical process control and process capability Mars climate orbiter Purpose of SPC is to monitor the distribution of a process to verify it remains constant in terms of its mean value and the variation around this mean or target value Data that exceed the control limit on the process control chart indicate that the mean, or the variability has changed for the process. A process that is in statistical control may not necessarily be producing according to design because control limits are based on the mean and sample distribution of the process, and not on the product or service design specifications. System is dictated by two major elements: Voice of process – internal operations. What you manage; what you control Voice of customer – external requirements. What your market demands or expects PROCESS CAPABILITY IS ABILITY OF THE PROCESS TO CONSISTENTLY MEET THE DESIGN SPECIFICATIONS OF THE “PRODUCT”
STATISTICS FOR BUSINESS (Six-sigma management) Implications when we say process is 99% correct (an incorrect standard for six-sigma) Mars climate orbiter • There are 20,000 lost articles of mail each hour • There is unsafe drinking water for about 15 minutes each day • There are 5,000 incorrect surgical procedures each week • There are two short or two long landings at most major airports each day • There are 200,000 wrong drug prescriptions each year • There is no electricity for almost seven hours each month
STATISTICS FOR BUSINESS (Six-sigma management) Mars climate orbiter Process capability: Examples An airplane offers a choice of beef and fish on its dinner menu. The airplane orders 100 meals of fish and 120 meals of beef for its 220 passengers. 130 passengers ask for fish. The process is not capable. A tour group wants to book 50 rooms in the hotel for a certain period. There are only 45 vacant rooms. The process is not capable. Your sales team promises delivery of a product in three weeks. The resources available in operations indicates four weeks are need to make the product. The process is not capable. 45 students enroll for a certain business course. The assigned teaching room has 35 places. The process is not capable. A hotel has a request for a conference for 120 attendees. The largest conference room holds a maximum of 100 people. The process is not capable. Medical centers or hospitals are sometimes overloaded with patients. Their process is not capable. (A major problem in Occidental countries for elderly people)
STATISTICS FOR BUSINESS (Six-sigma management) Mars climate orbiter Target value and variation or dispersion Target value is the mean or average value. It is what you aim for….. …..but dispersion is as important as the target value • Consider you are out hiking and you arrive at a river that you must wade across • A local tells you that the average depth of the water is 70 cm. • You think that you can manage that • Then another local tells you that the minimum depth is 5 cm and maximum is 135 cm. • That makes you reconsider! • Average body temperature is 37.5 °C • You have your feet in therefrigerator, 4 °C • Your head in the oven at 71 °C • But you are probably not very comfortable! • We might note that the average annual income of a certain country is $75,000 • The country is economically strong? • However 100,000 have annual income of over $1 million • 100,000 earn less than $10,000 per year. Hardly enough to live on!
STATISTICS FOR BUSINESS (Six-sigma management) Mars climate orbiter Non-conforming units beyond a lower and upper specification Sack of coffee has specification of 10.00 ± 0.01 kg Conforming units Non-conforming units Non-conforming units 10.1 kg 9.9 kg 10.0 kg
STATISTICS FOR BUSINESS (Six-sigma management) Non-conforming units beyond a lower specification Mars climate orbiter Daily revenues must not be less than $50,000 Conforming operations Non-conforming operations $50,000 $100,000
STATISTICS FOR BUSINESS (Six-sigma management) Non-conforming units beyond an upper specification level Mars climate orbiter Annual budget expenditures must not exceed $250,000 Conforming operations Non-conforming operations $250,000 $200,000
STATISTICS FOR BUSINESS (Six-sigma management) Front desk service time targeted at 10 min Mars climate orbiter • Product specifications are • what customer expects • Process specifications are • what system can provide • THEY ARE NOT THE SAME Process mean is centered on Product mean Target service time is 10 min But there will be upper and lower limit for service time 10 min
STATISTICS FOR BUSINESS (Six-sigma management) Mars climate orbiter Process capability ratio Most values of a process distribution lie within 3s of the mean or a range of 6s Process capability ratio, Cpis: (upper product specification – lower product specification)/(6s of process) From previous figure (Slide 10) • Based on the assumption that process mean is centered on product target value: • Process N° 1: Cp > 1.00: Process is capable (leptokurtic) • Process N° 2: Cp = 1.00: Process is just capable (mesokurtic) • Process N° 3: Cp < 1.00: Process is not capable (platykurtic) Process capability ratio sometime referred to as process potential as describes how capable the process could be if it were centered exactly between the product specifications
STATISTICS FOR BUSINESS (Six-sigma management) Mars climate orbiter Process capability index From Slide N° 10 • Assume upper specification level, USL, of customer service expectations is 16 minutes • Lower specification level, LSL is 4 minutes. This centered on a target of 10 minutes. • Tolerance, or product specification width, is 12.00 minutes (16 – 4) For process N° 1: If s = 1.50, then 6s = 9 and Cp = 1.33 (12.00/9.00) Capable most of the time. • For process N° 2: If s now increases to 2.00, then 6s = 12.00 and Cp = 1.00 (12.00/12.00) • Just capable most of the time • . • For process N° 3: If s increases now to 3.00, then 6s = 18.00 and Cp = 0.67 (12.00/18.00) • Not capable most of the time.
STATISTICS FOR BUSINESS (Six-sigma management) Mars climate orbiter Process capability ratio – short term Process width = normal process specification Process mean centered on product mean -6s -5s -4s -3s -2s -1s µ 1s 2s 3s 4s 5s 6s
STATISTICS FOR BUSINESS (Six-sigma management) Process capability – high performing Mars climate orbiter If there is no process shift, and product specification width is set at 6sor 12swith a process width of 3sor 6s then when process average is on product target: Cp = Product specification width Process width = 12s/6s = 2.00 Alternatively just considering right tail of distribution Cp = 0.5*Product specification width 0.5*Process width = 0.5*12s/3s = 2.00 At this level process would be very high performing Process limits are well inside the product specification)
STATISTICS FOR BUSINESS (Six-sigma management) Standard deviation and z-value Mars climate orbiter Upper specification limit Leptokurtic curve, z = 1, where s = 2.5 Mesokurtic curve, z = 1, where s = 5.0 Platykurticcurve, z = 1, where s = 10.0 Leptokurtic curve is the driver for Taguchi concepts Upper specification limit In leptokurtic curve USL = 3.00s In mesokurtic distribution USL = 1.50s In platykurticdistribution USL = 0.75s
STATISTICS FOR BUSINESS (Six-sigma management) Mars climate orbiter Variation In most activities there is variation in the short term. This is considered random or common cause variation. There is variation in the time to service a customer, the time to prepare a meal, the time for a delivery vehicle to arrive, the daily revenues recorded; etc. Often difficult to reduce. • Long term changes may occur, or a shift • Wear on tools and machines • Labor fatigue • New untrained staff • Delivery delays • Layout changes • Competition Six-sigma management is such that long-term changes, or a process shift can be accommodated
STATISTICS FOR BUSINESS (Six-sigma management) Short term variation then a process shift Mars climate orbiter Short term variation (Between 5 and 20 hours) New variation Short term variation Process shift – assignable change Long term variation (Between 20 and 45 hours)
STATISTICS FOR BUSINESS (Six-sigma management) Process shift: mean is same but variation has changed Mars climate orbiter Product specification limit LSL USL Short term Process is always producing conforming units Short term distribution Long term Process sometimes produces non-conforming units. Variation and mean have changed. Long term distribution
STATISTICS FOR BUSINESS (Six-sigma management) Mars climate orbiter New process: mean = 14 min Standard deviation of process is 2.00 Original process: mean = 10 min LSL = 4 min Mean= 10 min USL = 16 min
STATISTICS FOR BUSINESS (Six-sigma management) Process shift: Mean has changed: variability same for given mean Mars climate orbiter In six-sigma process shift of 1.5s is considered accepted shift for long-term
STATISTICS FOR BUSINESS (Six-sigma management) Mars climate orbiter Six-sigma with process shift: When the process mean has shifted with respect to design mean, process capability ratio is a adjusted by a factor k, to give a process capability index, Cpk K is percentage of product tolerance zone that is consumed by process shift Cpk = Cp(1 – k) k = Process shift/(0.5*Product design specification width) If there is a process shift of 1.5s (an often accepted value of process shift) then k = 1.5s/0.5*12s= 0.25 Cpk = Cp(1 – k) = 2.00 (1 – 0.25) = 1.50 It is this level of process capability that is aimed at in six-sigma quality
STATISTICS FOR BUSINESS (Six-sigma management) Mars climate orbiter Yield and hidden “factory” • 600 meals being prepared for a banquet • 120 meals do not conform (cooking degree; temperature; portion size, presentation • Non-conforming meals reworked; 105 are satisfactory; 15 are tossed 600 480 Inspection Process Initial output 120 105 Actual yield = 585/600 = 97.50% Final output Rework First time yield, YFT = 480/600 = 80.00% 15 Rework = 120/600 = 20.00% Scrap (waste) = 15/600 = 2.50% Scrap 585 Hidden factory is wasteful: It adds to cost but nothing to customer
STATISTICS FOR BUSINESS (Six-sigma management) Mars climate orbiter Delivery time and cycle time “Delivery” time Promised time to provide client with product or to serve client Theoretical Cycle time Total time for either product or client to pass through all process steps without delays, waiting, unnecessary transfer, rework, or setups Actual cycle time and delivery time When there are delays, actual cycle time is more than theoretical time and this increases delivery time. Delays are non-value added time and part of the “Hidden factory” or in services “hidden activity”
STATISTICS FOR BUSINESS (Six-sigma management) Cycle time, performance level, and hidden activity Mars climate orbiter Leptokurtic Low standard deviation Breakthroughs achieved Six-sigma performance Mesokurtic Intermediate standard deviation Resulting from investment in business Using Kaizen concept. TQM Platykurtic High standard deviation rework. Cycle time long