Download
1 / 102
1.03k likes | 1.28k Views
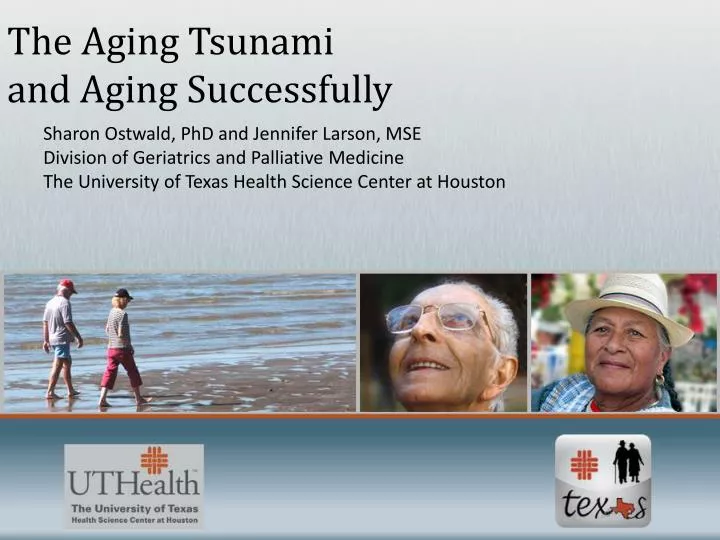
The Aging Tsunami and Aging Successfully. Sharon Ostwald, PhD and Jennifer Larson, MSE Division of Geriatrics and Palliative Medicine The University of Texas Health Science Center at Houston. Percent Population Aged 65 and Over: 2008.

E N D
The Aging Tsunami and Aging Successfully Sharon Ostwald, PhD and Jennifer Larson, MSE Division of Geriatrics and Palliative Medicine The University of Texas Health Science Center at Houston
Percent Population Aged 65 and Over: 2008 Source: Kinsella, Kevin and Wan He, U.S. Census Bureau, International Population Reports, P95/09-1, An Aging World: 2008, U.S. Government Printing Office, Washington, DC, 2009.
Percent Increase in Population Aged 65 and Over; 2008 to 2040 (selected countries) Source: Kinsella, Kevin and Wan He, U.S. Census Bureau, International Population Reports, P95/09-1, An Aging World: 2008, U.S. Government Printing Office, Washington, DC, 2009.
The World’s 25 Oldest Countries: 2008(Percent of population aged 65 and over) Source: Kinsella, Kevin and Wan He, U.S. Census Bureau, International Population Reports, P95/09-1, An Aging World: 2008, U.S. Government Printing Office, Washington, DC, 2009.
Percent Population Aged 65 and Over: 2040 Source: Kinsella, Kevin and Wan He, U.S. Census Bureau, International Population Reports, P95/09-1, An Aging World: 2008, U.S. Government Printing Office, Washington, DC, 2009.
Young Children & Older People as a Percentage of Global Population: 1950 to 2050 Source: Kinsella, Kevin and Wan He, U.S. Census Bureau, International Population Reports, P95/09-1, An Aging World: 2008, U.S. Government Printing Office, Washington, DC, 2009.
Population in Developed and Developing Countries by Age and Sex- 1960 Source: Kinsella, Kevin and Wan He, U.S. Census Bureau, International Population Reports, P95/09-1, An Aging World: 2008, U.S. Government Printing Office, Washington, DC, 2009.
Population in Developed and Developing Countries by Age and Sex- 2000 Source: Kinsella, Kevin and Wan He, U.S. Census Bureau, International Population Reports, P95/09-1, An Aging World: 2008, U.S. Government Printing Office, Washington, DC, 2009.
Population in Developed and Developing Countries by Age and Sex- 2040 Source: Kinsella, Kevin and Wan He, U.S. Census Bureau, International Population Reports, P95/09-1, An Aging World: 2008, U.S. Government Printing Office, Washington, DC, 2009.
Population Aging • Older Populations Will Increase More Rapidly in Developing than in Developed Countries Population Aging is Determined by Two Factors: • Birth rates • Death rates
Percent Increase in Population Aged 65 & Over: 2008 to 2040 Source: Kinsella, Kevin and Wan He, U.S. Census Bureau, International Population Reports, P95/09-1, An Aging World: 2008, U.S. Government Printing Office, Washington, DC, 2009.
The Speed of Population Aging in Selected Countries Source: Kinsella, Kevin and Wan He, U.S. Census Bureau, International Population Reports, P95/09-1, An Aging World: 2008, U.S. Government Printing Office, Washington, DC, 2009.
Life Expectancy is Increasing Life expectancy is a probability estimate of how long individuals can expect to live, given the environmental and disease conditions currently in existence. Life expectancy is dependent on the interaction of behaviors and exposures that occur over a lifetime with biology and psychology.
Life Expectancy at Birth for Selected Countries by Region: 2008 Source: Kinsella, Kevin and Wan He, U.S. Census Bureau, International Population Reports, P95/09-1, An Aging World: 2008, U.S. Government Printing Office, Washington, DC, 2009.
Age Expectancy at Age 65 in US MEN • 17.1 years life expectancy • 11.4 in good health • 5.6 dependent on others WOMEN • 20 years life expectancy • 13.3 in good health • 6.7 dependent on others
Female Advantage in Life Expectancy at Birth for Selected Countries: 2008 Source: Kinsella, Kevin and Wan He, U.S. Census Bureau, International Population Reports, P95/09-1, An Aging World: 2008, U.S. Government Printing Office, Washington, DC, 2009.
Highest National Life Expectancy at Birth: 1840 to 2000 Source: Kinsella, Kevin and Wan He, U.S. Census Bureau, International Population Reports, P95/09-1, An Aging World: 2008, U.S. Government Printing Office, Washington, DC, 2009.
Global Distribution of People Aged 80 and Over(Percent of world total in each country/region- 2008) Source: Kinsella, Kevin and Wan He, U.S. Census Bureau, International Population Reports, P95/09-1, An Aging World: 2008, U.S. Government Printing Office, Washington, DC, 2009.
Percent Change in the World’s Population: 2005-2040 Source: Kinsella, Kevin and Wan He, U.S. Census Bureau, International Population Reports, P95/09-1, An Aging World: 2008, U.S. Government Printing Office, Washington, DC, 2009.
Survival Curve for U.S. White Females: 1901 and 2003 Source: Kinsella, Kevin and Wan He, U.S. Census Bureau, International Population Reports, P95/09-1, An Aging World: 2008, U.S. Government Printing Office, Washington, DC, 2009.
Proportion of All Deaths Occurring at Age 65 or Over in 29 Countries/Areas: Circa 2001 Source: Kinsella, Kevin and Wan He, U.S. Census Bureau, International Population Reports, P95/09-1, An Aging World: 2008, U.S. Government Printing Office, Washington, DC, 2009.
Disparities Exist Between Urban and Rural People Aged 65 and Over AGING INDEX is an indicator of theage structure in a country. Higher numbers = more older people • China = 31 • Northern Africa = 16 • Northern America = 65
Major Causes of Death in the European Union by Age: 2001 Source: Kinsella, Kevin and Wan He, U.S. Census Bureau, International Population Reports, P95/09-1, An Aging World: 2008, U.S. Government Printing Office, Washington, DC, 2009.
The Increasing Burden of Chronic Noncommunicable Diseases on Low and Middle Income Countries Source: Kinsella, Kevin and Wan He, U.S. Census Bureau, International Population Reports, P95/09-1, An Aging World: 2008, U.S. Government Printing Office, Washington, DC, 2009.
Chronic Diseases Are Becoming An Increasing Burden Probability of Being Disabled at Ages 60 and Over Conditional on Early Childhood Health Conditions Latin American/Caribbean Cities* & in Puerto Rico: Circa 2001 *Cities include Bridgetown, Barbados; Buenos Aires, Argentina; Havana, Cuba; Mexico City, Mexico; Montevideo, Uruguay; Santiago, Chile; & Sao Paulo, Brazil Source: Kinsella, Kevin and Wan He, U.S. Census Bureau, International Population Reports, P95/09-1, An Aging World: 2008, U.S. Government Printing Office, Washington, DC, 2009.
Important Role of Geriatric Health Professionals is to Maintain Functional Independence and Prevent Excess Disability WHO (2002) Active Aging: A Policy Framework. Geneva: World Health Organization.
Chronic Disability Decline in the United States: 1982 to 2005 Source: Kinsella, Kevin and Wan He, U.S. Census Bureau, International Population Reports, P95/09-1, An Aging World: 2008, U.S. Government Printing Office, Washington, DC, 2009.
Older Dependency Ratio: 2008 Note: Older dependency ratio is the number of people aged 65 and over per 100 people aged 20 to 64. Source: Kinsella, Kevin and Wan He, U.S. Census Bureau, International Population Reports, P95/09-1, An Aging World: 2008, U.S. Government Printing Office, Washington, DC, 2009.
Older Dependency Ratio for World Regions:2000, 2020, & 2040 Source: Kinsella, Kevin and Wan He, U.S. Census Bureau, International Population Reports, P95/09-1, An Aging World: 2008, U.S. Government Printing Office, Washington, DC, 2009.
Standard and Alternative Older Dependency Ratios for Five Countries: 2006 Source: Kinsella, Kevin and Wan He, U.S. Census Bureau, International Population Reports, P95/09-1, An Aging World: 2008, U.S. Government Printing Office, Washington, DC, 2009.
Labor Force Participation Rate for Males Aged 55 to 64 in Six Latin American Countries Source: Kinsella, Kevin and Wan He, U.S. Census Bureau, International Population Reports, P95/09-1, An Aging World: 2008, U.S. Government Printing Office, Washington, DC, 2009.
Labor Force Participation Rate for Females Aged 55 to 64 in Six Latin American Countries Source: Kinsella, Kevin and Wan He, U.S. Census Bureau, International Population Reports, P95/09-1, An Aging World: 2008, U.S. Government Printing Office, Washington, DC, 2009.
Social Security Coverage in 13 Latin American Countries: Circa 2002(Percentage of employed population paying contributions) Source: Kinsella, Kevin and Wan He, U.S. Census Bureau, International Population Reports, P95/09-1, An Aging World: 2008, U.S. Government Printing Office, Washington, DC, 2009.
Health Promotion Needs to be a Major Focus for Geriatric Health Professionals • Regular exercise • Healthy diet • Avoid tobacco • Alcohol in moderation • Correct use of medications • Screen for disease and treat early • Education about caring for chronic illnesses • Strengthen social network
Social, Physical & Economic Environments Affect Healthy Aging
Living Arrangements for People Aged 65 and Over in Japan (in percent) Source: Kinsella, Kevin and Wan He, U.S. Census Bureau, International Population Reports, P95/09-1, An Aging World: 2008, U.S. Government Printing Office, Washington, DC, 2009.
Reasons for Geriatric Professionals to Focus on Health Promotion and Disease Prevention • Prevention of premature death • Delay of the onset of chronic diseases • Postponement of disability related to chronic diseases • Higher quality of life • Greater participation in the life of the family and community in paid and unpaid roles • Reduction in medical care costs, especially hospitalization and nursing home costs
Warning Signs of the Aging Tsunami • Rapid aging of the world’s population, especially in developing countries • Imbalance of people over 65 and under 15 • Increasing life expectancy with a rapid increase in numbers over 80 • Geographical inequities between urban and rural dwelling older people • Increasing prevalence of chronic diseases with a burden of disability • Social, physical & economic environments that affect healthy aging
Global Population Pyramid in 2002 & 2025 WHO (2002) Active Aging: A Policy Framework. Geneva: World Health Organization.
What is the difference between a geriatrician and a gerontologist? Geriatrics- the study of health and disease in later life. The comprehensive health care of older persons. Focuses on medical care and changes that occur with age as a result of disease. Gerontology- Greek translation literally meaning the study of old men. It is a multidisciplinary field that focuses on the biological, behavioral and social processes individuals go through as they grow from middle age through late life.
Why study aging? Individual responsibility - Is old age to be lived or endured? Value of healthy behavior - (i.e., smoking, will die anyway) The chance of growing old with disabilities due to poor health is much greater than dying quickly from them. Management of the aged -Your grandparents, parents, older siblings; you may have to be the primary caregiver. Professional careers – With the large number of aging adults, the number of careers working with the elderly will increase dramatically. Enlightened citizens - It is our duty to be knowledgeable. Health care provisions affect everyone. There are critical economic, political and moral issues.
How old is old?The study of health and aging Fact or Fiction?Myths regarding aging and the aged How long do people live?The biological theories of aging What is “normal” aging?The physiology of aging What illnesses effect elders most?Common geriatric syndromes Can late life really be enjoyable?The role of behavioral factors What will my quality of life be like?A glimpse at “Successful” Agers
Ageism “A prejudice or discrimination against the old because of ignorance, misconceptions and half-truths. It is an assumption that personal traits of older individuals and their situations are due to age alone, not other factors.” Ferrini &Ferrini, 2000
Myth or Fact? • Myth #1: At some point, all elderly people end up living in a nursing home • Myth #2: Dementia is a normal consequence of aging • Myth #3: Depression and suicide is rare in the elderly • Myth #4: Mammograms are no longer necessary after age 70
Myth or Fact? • Myth # 5: If it’s available over-the-counter, it must be safe • Myth # 6: The elderly are immune from domestic violence • Myth # 7: Physical restraints help prevent falls in the elderly • Myth # 8: Caring for the elderly is anything but challenging and rewarding
Physiologic Changes Associated with Aging • Heart & Lungs • Brain • Kidney & Bladder • Body Fat & Bone • Sensory Organs
What is Normal? Heart and Lungs • Heart muscle thickens with age. • Maximal oxygen consumption during exercise declines in both men & women. • The body’s ability to extract oxygen from blood diminishes with age. • Arteries tend to stiffen with age. • Maximum breathing (vital) capacity may decline by about 40 percent between the ages of 20 and 70.
What is Normal? The Brain • Brain becomes smaller & lighter with age • Reduction of blood to brain • Number of neurons decline in parts of the brain • Fewer synapses & receptors • Grey matter volume shrinkage • Pervasive white matter loss
What is Normal? Kidney and Bladder • Kidneys gradually become less efficient at extracting wastes from the blood. • Bladder capacity declines. Urinary incontinence, which may occur after tissues atrophy, particularly in women, can often be managed through exercise and behavioral techniques.