Download
1 / 48
480 likes | 812 Views
Topics. spatial saturation TOF imaging chemical saturation magnetization transfer. t=t 1 M L =0. t=t 2 M L =a. t=t 3 M L =b. 90 0 RF. . Review: Relaxation. …. t= M L =1. t=t 0. M L. t. t 0. t 1. t 2. t 3. Relaxation. t=t 3+ M L =0. t=t 4+ M L =0. 90 0 RF.

E N D
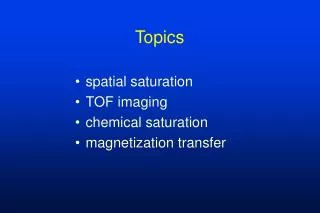
Topics • spatial saturation • TOF imaging • chemical saturation • magnetization transfer
t=t1 ML=0 t=t2 ML=a t=t3 ML=b 900 RF Review: Relaxation …. t= ML=1 t=t0 ML t t0 t1 t2 t3
Relaxation t=t3+ ML=0 t=t4+ ML=0 900 RF 900 RF 900 RF t=t4 ML<b t=t5 ML<<b t=t3 ML=b t=t0 TR TR
Equilibrium RF in • after 5 or so repetitions, the system reaches equilibrium • similar to water flowing into a leaky bucket equilibrium relaxation
longer TR, more recovery of ML shorter TR, less recovery of ML
TR and ML • prolonged TRs allow for more recovery of ML • shorter TRs allow for less recovery of ML • condition referred to as “partial saturation”
Saturation • “total” magnetization • application of additional RF pulses has no effect on proton orientation • saturation exists only briefly • net magnetization recovers longitudinal relaxation immediately after protons are “saturated”
Types of Saturation • spatial • fat • water • magnetization transfer (1st cousin)
Spatial Saturation • application of an RF pulse immediately prior to the imaging sequence saturates all of the protons under the influence of that pulse
Spatial Saturationpurpose/advantages • reduce motion artifacts in the phase encoding direction • swallowing • CSF pulsation • respiratory motion • reduce signal from flowing blood • facilitate angiography/venography
Spatial Saturationdisadvantages • fewer slices per TR • timing of saturation pulse prolongs effective TR interval • higher SAR
Spin Echo gradient frequency encode readout RF pulse RF pulse signal FID spin echo
Saturation RF pulse RF pulse signal no echo saturation pulse additional time required for single saturation pulse
z z z 0 RF y x y x y x Saturation Pulse 0 0 sat pulse t=t0 t=t0+ t=t0++ ML=0 SATURATION MXY=0 no signal
SAT pulses 900 RF pulses
Spatial Saturation saturation band within the FOV
arterial venous superior saturation pulse (arterial) Spatial Saturationoutside the FOV stack of slices 2D acquisition inferior saturation pulse (venous)
fully magnetized protons in arteries fully magnetized protons in veins end slices may have bright flow in arteries or veins arterial flow middle slices usually have “flow voids” in vessels partially saturated protons in vessels Entry Slice Phenomenon venous flow
s2 s3 s1 s1 s2 s3 blood moves downstream flow direction vessel saturated spins unsaturated spins s1 900RF s1 T=TE bright flow, entry slice phenom s2 900RF on saturated spins, flow void MR Flow Void
arterial venous superior saturation pulse (arterial) stack of slices 2D acquisition inferior saturation pulse (venous)
Summary: Flow Effects • entry slice phenomenon due to unsaturated spins • flow void due to saturation of previous slice coupled with downstream migration of spins • spatial presaturation bands can reduce (eliminate) signal from flowing blood
Magnetic Resonance Angiography • exploits flow enhancement of GR sequences • saturation of venous flow allows arterial visualization • saturation of arterial flow allows venous visualization • no IV contrast is required
tumor Magnetic Resonance Angiography AP projection Lateral projection right thigh
2D TOF Angiography • anatomy imaged using a series of gradient echo images • each image is acquired separately • all slices experience entry slice phenomenon • saturation pulse placed proximal for venous imaging, distal for arterial imaging
s1 s1 flow direction vessel presat band unsaturated spins s1 0RF s1 T=TE bright flow, entry slice phenom 2D TOF
2D TOF Angiography • saturation band is located the same distance from each slice to maximize its effect • “walking presat” • vascular images reconstructed using maximum intensity projection technique
MIP Reconstruction . . . lateral projection AP projection SPIRAL CT ANGIOGRAPHY
2D TOF • GR images used • short TR (~ 20-40 msec) • very short TE • shortest TE times minimize intravoxel dephasing resulting in maximum flow effects • small to medium flip angles
Chemical Saturation • similar to spatial saturation • narrow band RF pulse causes selective saturation of water or fat protons • “chem sat” • “fat sat” • compatible with many imaging sequences
Fat Sat fat selective bandwidth fat water frequency 220 Hz 1.5 T
Fat Saturation RF pulse RF pulse signal echo from water only fat sat pulse additional time required for saturation pulse
Fat Satadvantages • increase conspicuity of fluid on T2 weighted images • widens dynamic range • addresses FSE fat-fluid isointensity problem • post-gadolinium T1 weighted fat sat • reduced respiratory motion artifact
Fat Sat disadvantages • fewer slices per TR • timing of saturation pulse prolongs effective TR interval • higher SAR • requires homogenous magnet • shimming
Fat Sat disadvantages • requires uniformly shaped body part • doesn’t work well at base of neck, crook of ankle, etc. • not recommended with FOV > 30 cms • unreliable • works poorly at lower fields • S/N ratio drops
Fat Suppression and SNR • non fat-suppressed image • each image pixel comprised of signal from water and fat in the imaging voxel • fat-suppression • reduces total signal by suppression of fat from the voxel • reduces SNR
without fat suppresion high SNR with fat suppression lower SNR SI SI water and fat water only frequency frequency Fat Suppression
Magnetization Transfer with MT without MT TR 550, TE 15.7, 45° TR 450, TE 15.7, 45°
Magnetization Transfer • first cousin of Fat Sat • off-resonance RF pulse applied similar to Fat Sat pulse • “bound water” proton pool absorbs the RF energy • energy is transferred to “unbound” proton pool
Magnetization Transfer • think of as “tissue SAT” • tissues high in proteins (brain, muscle) become darker • MT pulse causes a selective saturation effect • tissues low in proteins relatively unaffected • fat • free fluid/water/edema
Magnetization Transfer saturation effect energy transfer MT pulse ~1000 kHz off-resonance free bound frequency
Magnetization Transfer RF pulse RF pulse signal echo MT pulse additional time required for saturation pulse
Magnetization Transferadvantages • generates T2-like weighting with GR images • good cartilage sequence • suppresses background tissues • improved TOF angiography • increased contrast (gadolinium) visualization
Magnetization Transferadvantages • magnetic field homogeneity not critical • generates images with new contrast relationships • compatible with many sequences; also compatible with fat sat
Magnetization Transfer disadvantages • fewer slices per TR • timing of saturation pulse prolongs effective TR interval • higher SAR
Magnetization Transfer with MT without MT TR 550, TE 15.7, 45° TR 450, TE 15.7, 45°