Download
1 / 43
430 likes | 486 Views
Lecture10 CORRELATION & REGRESSION. Xiaojin Yu Department of Epidemiology and Biostatistics, public Health school, Southeast University. review. Comparison of means :t –test Comparison of proportions: Chi-square test Comparison of Median: Rank sum test. Review on rank sum test.

E N D
Lecture10 CORRELATION & REGRESSION Xiaojin Yu Department of Epidemiology and Biostatistics, public Health school, Southeast University
review • Comparison of means :t –test • Comparison of proportions: Chi-square test • Comparison of Median: Rank sum test
Review on rank sum test • raw data and Rank ( cardinal and ordinal number) • Rank sum test_ methods based on rank • 2 independent groups_ willcoxon rank sum test • 2 paired groups_ sign rank sum test
Solution to height comparison height between F and M Blue-male Red- female 4
Cats rabbits minutes rank minutes rank 25 9.5 14 1 34 13 15 2 44 15 16 3 46 16 17 4 46 17 19 5 48 18 21 6.5 49 19 21 6.5 50 20 23 8 25 9.5 28 11 30 12 35 14 n1=8 T1=127.5 n2=12 T2=82.5 EXAMPLE 9.1: Table 9.1 Survival Times of Cats & Rabbits without oxygen
Solution to Example9.1 • H0:M1=M2 population locations of survival time of both cat and rabbit are equal H1: M1 ≠ M2population locations of survival time of both cat and rabbit are not equal ; a = 0.05 • Sorting and ranking, calculate 2 Rank sums of 2 groups. Take the Ti with small n as T. n1=8<n2=12, so T= T1 =127.5. • critical interval of T0.05 (58-110),T=127.5, is beyond of Tα, so, P≤α, Given α=0.05, P<0.05; H0 is rejected, it concludes that the survival times of cats and rabbits in the environment without oxygen might be different.
Basic logics of scientific research • To find the difference • To find the correlation
Contents • linear Correlation • Rank correlation • simple linear regression
Correlations in medicine • Drinking a glass of red wine per day may decrease your chances of a heart attack. • Taking one aspirin per day may decrease your chances of stroke or of a heart attack. • Eating lots of certain kinds of fish may improve your health and make you smarter. • Pregnant women that smoke tend to have low birthweight babies. • Taller people tend to weigh more • Animals with large brains tend to be more intelligent. • The more you study for an exam, the higher the score you are likely to receive.
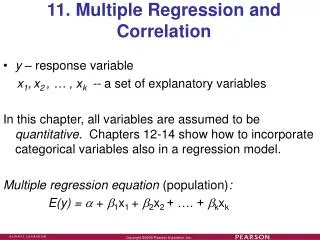
Model Types…Relationship between variables • Deterministic Model: an equation that allow us to fully determine the value of the dependent variable from the values of the independent variables. • S =R*R • Probabilistic Model: a method used to capture the randomness that is part of a real-life process. • Weight(Y,kg) vs. Height (X,cm)/ • For example: 18-years-old y=0.8X-69
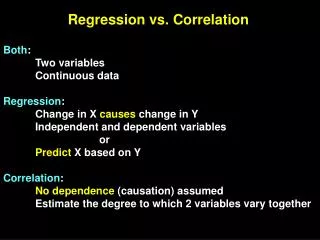
Correlation & regression • If we are interested only in determining whether a relationship exists, we use correlation analysis. • If we are interested in predicting the value of one variable (the dependent variable) on the basis of other variables (the independent variables),we use Regression analysis . • Dependent variable: denoted Y • Independent variables: denoted X1, X2, …, Xk
Scatter plot 71 69 Yheight of 20 years old(inch) 67 65 63 30 32 34 36 38 40 X height of 2 years old(inch)
Correlation • Concept • Calculate r • Statistical inference for population correlation coefficient Hypothesis test
Measure of correlation • Pearson’s Linear Correlation Coefficient, The correlation, denoted by r, measures the amount of linear association between two variables, strength and direction. • r is always between -1 and 1 inclusive. • [-1, 1] • Population’s Correlation Coefficient: ρ • Sample’s Correlation Coefficient: r
Null Positive Negative Null 0<r<1 -1<r<0 r=0 r=0 Completely Positive Completely Negative Null Null r=1 r=-1 r=0 r=0 Different Patterns of Correlation
Magnitude & direction • The larger the absolute value of correlation coefficient , the stronger the correlation. • If the sign is positive(+), the two variables varies at the same direction; If the sign is positive(-), the two variables varies at the opposite direction.
Hypothesis test for ρ • H0: ρ=0, there is no linear relationship between x and y ; • H1: ρ=0, there is linear relationship between x and y • Test methods ① t-test ② look up table
t test for pho H0:ρ=0 ,there is no linear relationship between 2 variables H1:ρ≠ 0, there is linear relationship between 2 variables ,α=0.05 • According t critical value,P<0.05,reject H0,accept H1,conclude that there islinear relationship between height of 2 years old and adult height. 。 ν=8-2=6
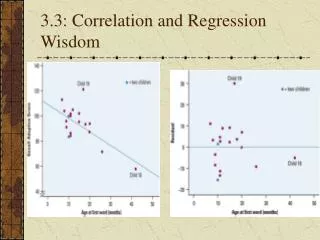
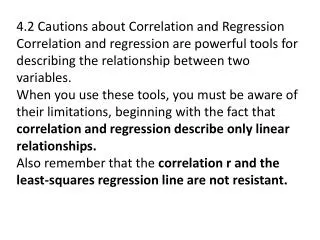
Caution: Correlation does not necessarily imply causation. • If X is correlated with Y, there could be five explanations: • X causes Y • Y causes X • X causes Y and Y causes X • Some third variable Z causes X and Y • The correlation is a coincidence; there is no causal relationship between X and Y.
some examples of correlations with implied causations • The more firemen that are fighting a fire, the bigger the fire is going to be. • Children that sleep with the light on are likely to develop nearsightedness later in life. • Women that take hormone replacement therapy (HRT) are less likely to have coronary heart disease. • As ice cream sales increase, the rate of drowning deaths increase.
Regression analysis • Correlation analysis tells us how close that relationship between 2 variables is • Regression analysis tells us something about relationship between 2 variables, how one changes with the other, can be used to predict another. • How to predict adult height based on height of 2 years old?
Why ‘regression? Francis Galton(1822-1911) • “regression” -British biologist F Galton • Like father, like son (Chinese proverb)
71 69 Y adult height(inch) 67 65 63 30 32 34 36 38 40 X height of 2 years old(inch) Scatter plot
Definition of variables • Y (dependent variable, response variable, outcome variable) • X (independent variable, explanatory variable, predictor variable) • Yhat is the average y when x is given.
Regression Equation • a is intercept,the value of y when X=0; • b, slope, 。 • b, regression coefficient, the average units that y change when x change by 1 units.
Steps of regression analysis • 1.Scatter plot for linear trend • 2.Estimate slope and intercept。 • 3.Draw regression line • 4.Significant test for b
Least Square Estimation (LSE) • principle:assure the sum ofsquared differences between Y’s and their estimates( residuals) based on regression line , that is least square estimation of regression parameters.
Least Square Estimation 71 69 Y adult height(inch) 67 65 63 30 32 34 36 38 40 X height of 2 years old
Draw regression line • Choose 2 x points that are not too close and easy to measure, calculate the estimates based on the equation. • For example, • X=30 Yhat=35.1776+0.9286×30= • X=36 Yhat=35.1776+0.9286×36=
Significance test for β • Population regression coefficient =0,there is no regression relationship. • H0: =0, there is no regression relationship between x and y ; • H1:0 , there is regression relationship between x and y ; • =0.05。
t-test for Regression coefficient H0: =0, there is no regression relationship between x and y ; H1:0 , there is regression relationship between x and y ; =0.05。 residual standard deviation of y-variation of y after removing the part that can be explained by x.
t-test for Regression coefficient H0: =0, there is no regression relationship between x and y ; H1:0 , there is regression relationship between x and y ; =0.05。 =8-2=6 According to t critical value ,P<0.01, reject H0 ,accept H1 at =0.05 significance level. there is regression relationship between 2 height variable.
t-test for regression and correlation • the results of t test for b and for r are equal for same dataset. So we can use the result of correlation coefficient in the test of regression coefficient.
Linear correlation & linear regression • Concept: • the show the degree of covariation between 2 variables • functional relationship between a dependent variable y and one or more independent variables • Range: • Unit b has unit, but r no unit • b and r have same direction