Download
1 / 21
210 likes | 266 Views
The Caprolactam segment accounts for the largest share in the Cyclohexanone market owing to its rising demand by the automotive and textile industry. The growing demand for Caprolactam across the globe for the production of Nylon is likely to boost the Cyclohexanone market in the upcoming years.

E N D
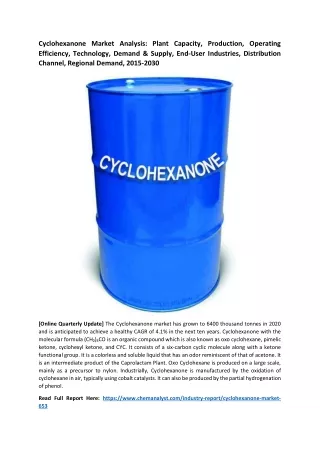
Cyclohexanone Market Analysis: Plant Capacity, Production, Operating Efficiency, Technology, Demand & Supply, End-User Industries, Distribution Channel, Regional Demand, 2015-2030 [Online Quarterly Update] The Cyclohexanone market has grown to 6400 thousand tonnes in 2020 and is anticipated to achieve a healthy CAGR of 4.1% in the next ten years. Cyclohexanone with the molecular formula (CH₂)₅CO is an organic compound which is also known as oxo cyclohexane, pimelic ketone, cyclohexyl ketone, and CYC. It consists of a six-carbon cyclic molecule along with a ketone functional group. It is a colorless and soluble liquid that has an odor reminiscent of that of acetone. It is an intermediate product of the Caprolactam Plant. Oxo Cyclohexane is produced on a large scale, mainly as a precursor to nylon. Industrially, Cyclohexanone is manufactured by the oxidation of cyclohexane in air, typically using cobalt catalysts. It can also be produced by the partial hydrogenation of phenol. Read Full Report Here: https://www.chemanalyst.com/industry-report/cyclohexanone-market- 653
Cyclohexanone is extensively used in the production of precursors to Nylon 6,6 and Nylon 6. The industry is driven by the exponential demand for Nylon which is widely used in various end-user industries around the globe. On the basis of application, the market is segmented into Caprolactam, adipic acid, solvents, and others. Cyclohexanone is largely utilized in the manufacturing of Caprolactam and Adipic acid. The Caprolactam segment accounts for the largest share in the Cyclohexanone market owing to its rising demand by the automotive and textile industry. The growing demand for Caprolactam across the globe for the production of Nylon is likely to boost the Cyclohexanone market in the upcoming years. Based on end-use industries, the market is segregated into paint & coatings, fertilizers, chemicals, textiles, automotive, pharmaceuticals, and others. Continuously increasing demand for Nylon 6,6 due to its versatile properties such as high tensile strength and heat and chemical resistance by end-use industries is anticipated to boost the Cyclohexanone market in the next few years. Surging demand from the chemical and textile industry will further propel the Oxo Cyclohexane market in the future. In 2020, the Oxo Cyclohexane market witnessed a negative impact around the world due to the spread of COVID-19. Government authorities in emerging economies imposed countrywide lockdowns and strict social distancing restrictions which led to the severe decline in demand for the organic compound and further affected the global supply chain. Many end-user industries including chemical, automotive, and others were drastically affected during the first half of 2020. Manufacturing units temporarily halted their functions and operations in order to curb the spread of coronavirus. However, with the gradual opening of the market, the Cyclohexanone industry is anticipated to regain its growth by the end of the year. Years considered for this report: Historical Period: 2015-2019 Base Year: 2020 Estimated Year: 2021 Forecast Period: 2022–2030 Objective of the Study: •To assess the demand-supply scenario of Cyclohexanone which covers production, demand, and supply of Cyclohexanone market globally. •To analyse and forecast the market size of Cyclohexanone. •To classify and forecast Cyclohexanone market based on application, technology, end-use and regional distribution. •To identify drivers and challenges for Cyclohexanone market. •To examine competitive developments such as expansions, new product launches, mergers & acquisitions, etc., in Cyclohexanone market. •To identify and analyse the profile of leading players involved in the manufacturing of Cyclohexanone.
Regional Outlook: Among different regions, the Asia Pacific region dominated the Cyclohexanone market across the globe in 2020 and is expected to maintain its dominance until the forecast period owing to the expansion of major end-use industries in the region. Rapidly growing demand for Caprolactam and Adipic Acid is likely to boost the Cyclohexanone market in the Asia Pacific region. The easy availability of labor and fundings for industrial growth in emerging countries like China and India is another factor augmenting the market growth of Cyclohexanone in the region. In Europe, the increasing demand for Caprolactam from the automotive industry is expected to boost the Cyclohexanone market in the upcoming years. Key Players: •DuPont de Nemours •Asahi Kasei •Formosa Plastic Group •Lipeng Corporation Ltd. •Rhodia S.A •BASF SE •Gujarat State Fertilizers & Chemicals Ltd. •Honeywell International Inc. •Sheerji Chemical •TPCC •UBE INDUSTRIES, LTD., and Others. Report Scope: In this report, Cyclohexanone market has been segmented into following categories, in addition to the industry trends which have also been detailed below:
Attribute Details Market size volume in 2020 6400 thousand Tonnes Growth Rate CAGR of 4.1% from 2021 to 2030 Base year for estimation 2020 Historic Data 2015 – 2019 Forecast period 2021 – 2030 Quantitative units Revenue in USD million/billion and CAGR from 2021 to 2030 Report coverage Revenue forecast, demand & supply, competitive analysis, competitive landscape, growth factors, and trends Segments covered 1. 2. End-Use (Paint & Coatings, Fertilizers, Chemicals, Textiles, Automotive, Pharmaceuticals, 3. Sales Channel (Direct Company Sale, Direct Import, Distributors & Traders) Application (Caprolactam, Adipic Acid, Solvents, and Others) and Others) Regional scope North America; Europe; Asia Pacific; South America; Middle East & Africa Country scope United States; Mexico; Canada; China; India; Japan; South Korea; Taiwan; Singapore; Germany; Belgium; France; United Kingdom; Spain; Italy; Sweden; Austria; Saudi Arabia; Iran; South Africa; Brazil; Argentina Key companies profiled DuPont de Nemours, Asahi Kasei, Formosa Plastic Group, Lipeng Corporation Ltd., Rhodia S.A, BASF SE, Gujarat State Fertilizers & Chemicals Ltd., Honeywell International Inc., Sheerji Chemical, TPCC, UBE INDUSTRIES, LTD., and Others. Customization scope Free report customization with purchase. Addition or alteration to country, regional & segment scope. Pricing and purchase options Avail customized purchase options to meet your exact research needs. Explore purchase options To extract data for Cyclohexanone market, primary research surveys were conducted with Cyclohexanone manufacturers, suppliers, distributors, wholesalers, and end users. While interviewing, the respondents were also inquired about their competitors. Through this technique, ChemAnalyst was able to include manufacturers that could not be identified due to the limitations of secondary research. Moreover, ChemAnalyst analyzed various end user segments and projected a positive outlook for Global Cyclohexanone market over the coming years. ChemAnalyst calculated Cyclohexanone demand globally by analyzing the historical data and demand forecast which was carried out considering imported Cyclohexanone, styrene prices, monomers used for production of Cyclohexanone. ChemAnalyst sourced these values from industry experts and company representatives and externally validated through analyzing historical sales data of respective manufacturers to arrive at the overall market size. Various secondary sources such as company websites, association reports, annual reports, etc., were also studied by ChemAnalyst.
Key Target Audience: •Cyclohexanone manufacturers and other stakeholders •Organizations, forums, and alliances related to Cyclohexanone distribution •Government bodies such as regulating authorities and policy makers •Market research organizations and consulting companies The study is useful in providing answers to several critical questions that are important for industry stakeholders such as Cyclohexanone manufacturers, customers, and policy makers. The study would also help them to target the growing segments over the coming years (next two to five years), thereby aiding the stakeholders in taking investment decisions and facilitating their expansion. TABLE OF CONTENTS: 1. Global Cyclohexanone Market Outlook, 2015-2030 1.1. Capacity, By Volume 1.1.1. By Company 1.2. Production, By Volume 1.2.1. By Company 1.3. Operating Efficiency 1.3.1. By Company 2. Global Cyclohexanone Demand Outlook, 2015-2030, By Volume 2.1. By End use 2.2. By Application 2.3. By Region 2.4. By Company 3. North America Cyclohexanone Market Outlook, 2015-2030 3.1. Capacity, By Volume 3.1.1. By Country 3.2. Production 3.2.1. By Country 3.3. Operating Efficiency 3.3.1. By Country 4. North America Cyclohexanone Demand Outlook, 2015-2030, By Volume 4.1. By End use 4.2. By Application
4.3. By Country 4.4. United States Cyclohexanone Market Outlook, 2015-2030 4.4.1. Capacity, By Volume 4.4.1.1. By Company 4.4.1.2. By Location 4.4.2. Production 4.4.2.1. By Company 4.4.3. Operating Efficiency 4.4.3.1. By Company 4.4.4. United States Cyclohexanone Demand-Supply Scenario, 2015-2030, By Volume 4.4.4.1. Demand 4.4.4.2. Supply 4.4.4.3. Gap 4.4.5. United States Cyclohexanone Demand Outlook, 2015-2030, By Volume 4.4.5.1. By End use 4.4.5.2. By Application 4.4.5.3. By Company Share (At least top 3 companies’ market share) 4.4.5.4. By Region 4.4.5.5. By Sales Channel 4.5. Mexico Cyclohexanone Market Outlook, 2015-2030 4.5.1. Capacity, By Volume 4.5.1.1. By Company 4.5.1.2. By Location 4.5.2. Production 4.5.2.1. By Company 4.5.3. Operating Efficiency 4.5.3.1. By Company 4.5.4. Mexico Cyclohexanone Demand-Supply Scenario, 2015-2030, By Volume 4.5.4.1. Demand 4.5.4.2. Supply 4.5.4.3. Gap
4.5.5. Mexico Cyclohexanone Demand Outlook, 2015-2030, By Volume 4.5.5.1. By End Use 4.5.5.2. By Application 4.5.5.3. By Company Share (At least top 3 companies’ market share) 4.5.5.4. By Region 4.5.5.5. By Sales Channel 4.6. Canada Cyclohexanone Market Outlook, 2015-2030 4.6.1. Capacity, By Volume 4.6.1.1. By Company 4.6.1.2. By Location 4.6.2. Production 4.6.2.1. By Company 4.6.3. Operating Efficiency 4.6.3.1. By Company 4.6.4. Canada Cyclohexanone Demand-Supply Scenario, 2015-2030, By Volume 4.6.4.1. Demand 4.6.4.2. Supply 4.6.4.3. Gap 4.6.5. Canada Cyclohexanone Demand Outlook, 2015-2030, By Volume 4.6.5.1. By End Use 4.6.5.2. By Application 4.6.5.3. By Company Share (At least top 3 companies’ market share) 4.6.5.4. By Region 4.6.5.5. By Sales Channel 5. Asia Pacific Cyclohexanone Market Outlook, 2015-2030 5.1. Capacity, By Volume 5.1.1. By Country 5.2. Production 5.2.1. By Country 5.3. Operating Efficiency 5.3.1. By Country
6. Asia Pacific Cyclohexanone Demand Outlook, 2015-2030, By Volume 6.1. By Type 6.2. By Application 6.3. By Country 6.4. China Cyclohexanone Market Outlook, 2015-2030 6.4.1. Capacity, By Volume 6.4.1.1. By Company 6.4.1.2. By Location 6.4.2. Production 6.4.2.1. By Company 6.4.3. Operating Efficiency 6.4.3.1. By Company 6.4.4. China Cyclohexanone Demand-Supply Scenario, 2015-2030, By Volume 6.4.4.1. Demand 6.4.4.2. Supply 6.4.4.3. Gap 6.4.5. China Cyclohexanone Demand Outlook, 2015-2030, By Volume 6.4.5.1. By End Use 6.4.5.2. By Application 6.4.5.3. By Company Share (At least top 3 companies’ market share) 6.4.5.4. By Region 6.4.5.5. By Sales Channel 6.5. India Cyclohexanone Market Outlook, 2015-2030 6.5.1. Capacity, By Volume 6.5.1.1. By Company 6.5.1.2. By Location 6.5.2. Production 6.5.2.1. By Company 6.5.3. Operating Efficiency 6.5.3.1. By Company 6.5.4. India Cyclohexanone Demand-Supply Scenario, 2015-2030, By Volume
6.5.4.1. Demand 6.5.4.2. Supply 6.5.4.3. Gap 6.5.5. India Cyclohexanone Demand Outlook, 2015-2030, By Volume 6.5.5.1. By End use 6.5.5.2. By Application 6.5.5.3. By Company Share (At least top 3 companies’ market share) 6.5.5.4. By Region 6.5.5.5. By Sales Channel 6.6. Japan Cyclohexanone Market Outlook, 2015-2030 6.6.1. Capacity, By Volume 6.6.1.1. By Company 6.6.1.2. By Location 6.6.2. Production 6.6.2.1. By Company 6.6.3. Operating Efficiency 6.6.3.1. By Company 6.6.4. Japan Cyclohexanone Demand-Supply Scenario, 2015-2030, By Volume 6.6.4.1. Demand 6.6.4.2. Supply 6.6.4.3. Gap 6.6.5. Japan Cyclohexanone Demand Outlook, 2015-2030, By Volume 6.6.5.1. By End Use 6.6.5.2. By Application 6.6.5.3. By Company Share (At least top 3 companies’ market share) 6.6.5.4. By Region 6.6.5.5. By Sales Channel 6.7. South Korea Cyclohexanone Market Outlook, 2015-2030 6.7.1. Capacity, By Volume 6.7.1.1. By Company 6.7.1.2. By Location
6.7.2. Production 6.7.2.1. By Company 6.7.3. Operating Efficiency 6.7.3.1. By Company 6.7.4. South Korea Cyclohexanone Demand-Supply Scenario, 2015-2030, By Volume 6.7.4.1. Demand 6.7.4.2. Supply 6.7.4.3. Gap 6.7.5. South Korea Cyclohexanone Demand Outlook, 2015-2030, By Volume 6.7.5.1. By End Use 6.7.5.2. By Application 6.7.5.3. By Company Share (At least top 3 companies’ market share) 6.7.5.4. By Region 6.7.5.5. By Sales Channel 6.8. Taiwan Cyclohexanone Market Outlook, 2015-2030 6.8.1. Capacity, By Volume 6.8.1.1. By Company 6.8.1.2. By Location 6.8.2. Production 6.8.2.1. By Company 6.8.3. Operating Efficiency 6.8.3.1. By Company 6.8.4. Taiwan Cyclohexanone Demand-Supply Scenario, 2015-2030, By Volume 6.8.4.1. Demand 6.8.4.2. Supply 6.8.4.3. Gap 6.8.5. Taiwan Cyclohexanone Demand Outlook, 2015-2030, By Volume 6.8.5.1. By End Use 6.8.5.2. By Application 6.8.5.3. By Region 6.8.5.4. By Sales Channel
6.8.5.5. By Company Share (At least top 3 companies’ market share) 6.9. Singapore Cyclohexanone Market Outlook, 2015-2030 6.9.1. Capacity, By Volume 6.9.1.1. By Company 6.9.1.2. By Location 6.9.2. Production 6.9.2.1. By Company 6.9.3. Operating Efficiency 6.9.3.1. By Company 6.9.4. Singapore Cyclohexanone Demand-Supply Scenario, 2015-2030, By Volume 6.9.4.1. Demand 6.9.4.2. Supply 6.9.4.3. Gap 6.9.5. Singapore Cyclohexanone Demand Outlook, 2015-2030, By Volume 6.9.5.1. By End Use 6.9.5.2. By Application 6.9.5.3. By Region 6.9.5.4. By Sales Channel 6.9.5.5. By Company Share (At least top 3 companies’ market share) 7. Europe Cyclohexanone Market Outlook, 2015-2030 7.1. Capacity, By Volume 7.1.1. By Country 7.2. Production 7.2.1. By Country 7.3. Operating Efficiency 7.3.1. By Country 8. Europe Cyclohexanone Demand Outlook, 2015-2030, By Volume 8.1. By End Use 8.2. By Application 8.3. By Sales Channel (Direct/Institutional Sales, Retail Sales, Other Channel Sales) 8.4. By Country
8.5. Germany Cyclohexanone Market Outlook, 2015-2030 8.5.1. Capacity, By Volume 8.5.1.1. By Company 8.5.1.2. By Location 8.5.2. Production 8.5.2.1. By Company 8.5.3. Operating Efficiency 8.5.3.1. By Company 8.5.4. Germany Cyclohexanone Demand-Supply Scenario, 2015-2030, By Volume 8.5.4.1. Demand 8.5.4.2. Supply 8.5.4.3. Gap 8.5.5. Germany Cyclohexanone Demand Outlook, 2015-2030, By Volume 8.5.5.1. By Type 8.5.5.2. By Application 8.5.5.3. By Company Share (At least top 3 companies’ market share) 8.5.5.4. By Region 8.5.5.5. By Sales Channel 8.5.6. Belgium Cyclohexanone Market Outlook, 2015-2030 8.5.6.1. Capacity, By Volume 8.5.6.1.1. By Company 8.5.6.1.2. By Location 8.5.6.2. Production 8.5.6.2.1. By Company 8.5.6.3. Operating Efficiency 8.5.6.3.1. By Company 8.5.7. Belgium Cyclohexanone Demand-Supply Scenario, 2015-2030, By Volume 8.5.7.1. Demand 8.5.7.2. Supply 8.5.7.3. Gap 8.5.8. Belgium Cyclohexanone Demand Outlook, 2015-2030, By Volume
8.5.8.1. By End Use 8.5.8.2. By Application 8.5.8.3. By Sales Channel 8.5.8.4. By Company Share (At least top 3 companies’ market share) 8.5.8.5. By Region 8.6. France Cyclohexanone Market Outlook, 2015-2030 8.6.1. Capacity, By Volume 8.6.1.1. By Company 8.6.1.2. By Location 8.6.2. Production 8.6.2.1. By Company 8.6.3. Operating Efficiency 8.6.3.1. By Company 8.6.4. France Cyclohexanone Demand-Supply Scenario, 2015-2030, By Volume 8.6.4.1. Demand 8.6.4.2. Supply 8.6.4.3. Gap 8.6.5. France Cyclohexanone Demand Outlook, 2015-2030, By Volume 8.6.5.1. By End use 8.6.5.2. By Application 8.6.5.3. By Sales Channel 8.6.5.4. By Company Share (At least top 3 companies’ market share) 8.6.5.5. By Region 8.7. United Kingdom Cyclohexanone Market Outlook, 2015-2030 8.7.1. Capacity, By Volume 8.7.1.1. By Company 8.7.1.2. By Location 8.7.2. Production 8.7.2.1. By Company 8.7.3. Operating Efficiency 8.7.3.1. By Company
8.7.4. United Kingdom Cyclohexanone Demand-Supply Scenario, 2015-2030, By Volume 8.7.4.1. Demand 8.7.4.2. Supply 8.7.4.3. Gap 8.7.5. United Kingdom Cyclohexanone Demand Outlook, 2015-2030, By Volume 8.7.5.1. By End use 8.7.5.2. By Application 8.7.5.3. By Sales Channel 8.7.5.4. By Company Share (At least top 3 companies’ market share) 8.7.5.5. By Region 8.8. Spain Cyclohexanone Market Outlook, 2015-2030 8.8.1. Capacity, By Volume 8.8.1.1. By Company 8.8.1.2. By Location 8.8.2. Production 8.8.2.1. By Company 8.8.3. Operating Efficiency 8.8.3.1. By Company 8.8.4. Spain Cyclohexanone Demand-Supply Scenario, 2015-2030, By Volume 8.8.4.1. Demand 8.8.4.2. Supply 8.8.4.3. Gap 8.8.5. Spain Cyclohexanone Demand Outlook, 2015-2030, By Volume 8.8.5.1. By End use 8.8.5.2. By Application 8.8.5.3. By Sales Channel 8.8.5.4. By Company Share (At least top 3 companies’ market share) 8.8.5.5. By Region 8.9. Italy Cyclohexanone Market Outlook, 2015-2030 8.9.1. Capacity, By Volume 8.9.1.1. By Company
8.9.1.2. By Location 8.9.2. Production 8.9.2.1. By Company 8.9.3. Operating Efficiency 8.9.3.1. By Company 8.9.4. Italy Cyclohexanone Demand-Supply Scenario, 2015-2030, By Volume 8.9.4.1. Demand 8.9.4.2. Supply 8.9.4.3. Gap 8.9.5. Italy Cyclohexanone Demand Outlook, 2015-2030, By Volume 8.9.5.1. By End use 8.9.5.2. By Application 8.9.5.3. By Sales Channel 8.9.5.4. By Company Share (At least top 3 companies’ market share) 8.9.5.5. By Region 8.10. Sweden Cyclohexanone Market Outlook, 2015-2030 8.10.1. Capacity, By Volume 8.10.1.1. By Company 8.10.1.2. By Location 8.10.2. Production 8.10.2.1. By Company 8.10.3. Operating Efficiency 8.10.3.1. By Company 8.10.4. Sweden Cyclohexanone Demand-Supply Scenario, 2015-2030, By Volume 8.10.4.1. Demand 8.10.4.2. Supply 8.10.4.3. Gap 8.10.5. Sweden Cyclohexanone Demand Outlook, 2015-2030, By Volume 8.10.5.1. By End use 8.10.5.2. By Application 8.10.5.3. By Sales Channel
8.10.5.4. By Company Share (At least top 3 companies’ market share) 8.10.5.5. By Region 8.11. Austria Cyclohexanone Market Outlook, 2015-2030 8.11.1. Capacity, By Volume 8.11.1.1. By Company 8.11.1.2. By Location 8.11.2. Production 8.11.2.1. By Company 8.11.3. Operating Efficiency 8.11.3.1. By Company 8.11.4. Austria Cyclohexanone Demand-Supply Scenario, 2015-2030, By Volume 8.11.4.1. Demand 8.11.4.2. Supply 8.11.4.3. Gap 8.11.5. Austria Cyclohexanone Demand Outlook, 2015-2030, By Volume 8.11.5.1. By End use 8.11.5.2. By Application 8.11.5.3. By Sales Channel 8.11.5.4. By Company Share (At least top 3 companies’ market share) 8.11.5.5. By Region 9. MEA Cyclohexanone Market Outlook, 2015-2030 9.1. Capacity, By Volume 9.1.1. By Country 9.2. Production 9.2.1. By Country 9.3. Operating Efficiency 9.3.1. By Country 10. MEA Cyclohexanone Demand Outlook, 2015-2030, By Volume 10.1. By End use 10.2. By Application 10.3. By Sales Channel
10.4. By Country 10.5. Saudi Arabia Cyclohexanone Market Outlook, 2015-2030 10.5.1. Capacity, By Volume 10.5.1.1. By Company 10.5.1.2. By Location 10.5.2. Production 10.5.2.1. By Company 10.5.3. Operating Efficiency 10.5.3.1. By Company 10.5.4. Saudi Arabia Cyclohexanone Demand-Supply Scenario, 2015-2030, By Volume 10.5.4.1. Demand 10.5.4.2. Supply 10.5.4.3. Gap 10.5.5. Saudi Arabia Cyclohexanone Demand Outlook, 2015-2030, By Volume 10.5.5.1. By End use 10.5.5.2. By Application 10.5.5.3. By Sales Channel 10.5.5.4. By Company Share (At least top 3 companies’ market share) 10.5.5.5. By Region 10.6. Iran Cyclohexanone Market Outlook, 2015-2030 10.6.1. Capacity, By Volume 10.6.1.1. By Company 10.6.1.2. By Location 10.6.2. Production 10.6.2.1. By Company 10.6.3. Operating Efficiency 10.6.3.1. By Company 10.6.4. Iran Cyclohexanone Demand-Supply Scenario, 2015-2030, By Volume 10.6.4.1. Demand 10.6.4.2. Supply 10.6.4.3. Gap
10.6.5. Iran Cyclohexanone Demand Outlook, 2015-2030, By Volume 10.6.5.1. By End use 10.6.5.2. By Application 10.6.5.3. By Sales Channel 10.6.5.4. By Company Share (At least top 3 companies’ market share) 10.6.5.5. By Region. 10.7. South Africa Cyclohexanone Market Outlook, 2015-2030 10.7.1. Capacity, By Volume 10.7.1.1. By Company 10.7.1.2. By Location 10.7.2. Production 10.7.2.1. By Company 10.7.3. Operating Efficiency 10.7.3.1. By Company 10.7.4. South Africa Cyclohexanone Demand-Supply Scenario, 2015-2030, By Volume 10.7.4.1. Demand 10.7.4.2. Supply 10.7.4.3. Gap 10.7.5. South Africa Cyclohexanone Demand Outlook, 2015-2030, By Volume 10.7.5.1. By End use 10.7.5.2. By Application 10.7.5.3. By Sales Channel 10.7.5.4. By Company Share (At least top 3 companies’ market share) 10.7.5.5. By Region 11. South America Cyclohexanone Market Outlook, 2015-2030 11.1. Capacity, By Volume 11.1.1. By Country 11.2. Production 11.2.1. By Country 11.3. Operating Efficiency 11.3.1. By Country
12. South America Cyclohexanone Demand Outlook, 2015-2030, By Volume 12.1. By End use 12.2. By Application 12.3. By Sales Channel (Direct/Institutional Sales, Retail Sales, Other Channel Sales) 12.4. By Company Share (At least top 3 companies’ market share) 12.5. By Country 12.6. Brazil Cyclohexanone Market Outlook, 2015-2030 12.6.1. Capacity, By Volume 12.6.1.1. By Company 12.6.1.2. By Location 12.6.2. Production 12.6.2.1. By Company 12.6.3. Operating Efficiency 12.6.3.1. By Company 12.6.4. Brazil Cyclohexanone Demand-Supply Scenario, 2015-2030, By Volume 12.6.4.1. Demand 12.6.4.2. Supply 12.6.4.3. Gap 12.6.5. Brazil Cyclohexanone Demand Outlook, 2015-2030, By Volume 12.6.5.1. By End use 12.6.5.2. By Application 12.6.5.3. By Sales Channel 12.6.5.4. By Company Share (At least top 3 companies’ market share) 12.6.5.5. By Region 12.7. Argentina Cyclohexanone Market Outlook, 2015-2030 12.7.1. Capacity, By Volume 12.7.1.1. By Company 12.7.1.2. By Location 12.7.2. Production 12.7.2.1. By Company 12.7.3. Operating Efficiency
12.7.3.1. By Company 12.7.4. Argentina Cyclohexanone Demand-Supply Scenario, 2015-2030, By Volume 12.7.4.1. Demand 12.7.4.2. Supply 12.7.4.3. Gap 12.7.5. Argentina Cyclohexanone Demand Outlook, 2015-2030, By Volume 12.7.5.1. By End use 12.7.5.2. By Application 12.7.5.3. By Sales Channel 12.7.5.4. By Company Share (At least top 3 companies’ market share 12.7.5.5. By Region 13. Country-wise Import 14. Country-wise Export 15. News and Deals About Us ChemAnalyst is a leading provider of chemical commodity prices in more than 12 countries. The company has emerged as a preferred pricing supplier amongst Procurement Managers and Strategy Professionals globally who wants to track near real time prices of chemicals on its interactive dashboard. Unlike most of its competitors such as ICIS, IHS & S&P Platts the company doesn’t believe in delivering prices in PDF reports. The company has developed proprietary algorithm based online subscription platform in which users can track years of historical prices of more than 250 chemical commodities. In addition, since it’s all online, the users cannot just compare prices across multiple countries but also with other commodities and play with the data by generating multiple graphs to find out amazing insights. The users get access to grade wise CIF, CFR & Ex Works prices at multiple ports in each country. ChemAnalyst also provides market analysis for more than 1000+ chemical commodities such as Production, Demand, Supply, Plant Operating Rate, Imports, Exports, Suppliers, Customers and much more. The company has created online interactive dashboard in which customers can access all this data instantly with a click of a button. The users will not only be able to analyse historical data for past years but will also get to analyse short term and long-term forecasts for coming years. With the access to local field teams, the company can provide high quality reliable market analysis data for more than 20 countries. ChemAnalyst is a one stop solution for all the data related needs. We at ChemAnalyst are committed to assist customers worldwide with their data and insights needs using our comprehensive online platform. For more information, please visit us at www.chemanalyst.com Contact Us:
Nilesh Vishwakarma B-44 Sector-57 Noida, National Capital Region Tel: 0120-4523948 Mob: +91-8882336899 Email: info@chemanalyst.com