Download
1 / 17
170 likes | 317 Views
iLearnNYC Symposium. Data Reporting and Achievement iLearnNYC provides four separate data layers that offer insight into Student Learning and Achievement. 1. iLearnNYC Learning Environment Student-Level Analytics. 3. iLearnNYC Admin Console Analytics Reports and Charts. 2.

E N D
Data Reporting and Achievement iLearnNYC provides four separate data layers that offer insight into Student Learning and Achievement 1 iLearnNYC Learning Environment Student-Level Analytics 3 iLearnNYC Admin Console Analytics Reports and Charts 2 iLearnNYC Learning Environment Class-Level Analytics 4 iLearnNYC Partners Learning Environment Analytics
iLearnNYC Learning Environment Student-Level Analytics • Once Teachers set up gradeable items such as quizzes, assignments, discussions, projects, reflections, and written samples, students can track these items on their own. • Students can look at their Grades section, access all their Gradeable Items by category, check their individual and overall Grade, and monitor/control their own progress.
iLearnNYC Learning Environment Class-Level Analytics • Teachers can look at a whole class picture or drill down to individual student and gradeable item • Available class views can contribute real-time authentic data to processes like Inquiry, Progress Review, Parent-Teacher Conferences, Alignment, and Departmental meetings • Other views can look at data on usage and attendance, such as total student Logins, days since last time in, IP where they logged in from and more.
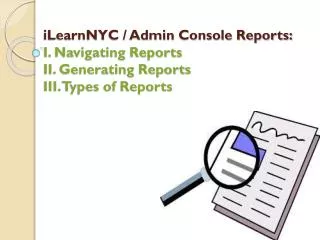
iLearnNYC Admin Console Analytics Reports and Charts • Five DifferentReporting Areas: License Usage, StudentEnrollment, Student Progress, Courses, TeacherActivity • ThreedifferentViews: By School, By Class, by Student • Dashboard Insight: Real-Time Charts • iLearn Partner Analytics Queried and Included
iLearnNYC Partners Learning Environment Analytics • Each iLearnNYC Partner offers their own unique environment for data mining. They have designed these offerings competitively, to differentiate their products in the marketplace. • We include selected samples of School- and Class-wide reporting, for Students, teachers, and Admins in APEX, ACHIEVE3000, and Middlebury Powerspeak. • Not shown here are our other partners, with curriculum-based products, offer rich and varied Reports and Analytics environments: Compass Odyssey, Edgenuity, Write2Learn, MathXL, Aventa, CLASS.COM, Aries, Carnegie, Florida Virtual Schools.