Download
1 / 21
230 likes | 491 Views
Introduction to Fault Diagnosis and Isolation(FDI). By Hariharan Kannan. Fault Detection & Isolation – An Overview. Goal of FDI: To meet the requirements of reliability, Safety and low cost operation for today’s engineering systems.

E N D
Introduction to Fault Diagnosis and Isolation(FDI) By Hariharan Kannan
Fault Detection & Isolation – An Overview • Goal of FDI: • To meet the requirements of reliability, Safety and low cost operation for today’s engineering systems. • To accurately isolate problems and make control changes to bring system behavior back to desired operating ranges or at least a safe mode of operation.
Idea of Model Based Diagnosis • A set of variables called observations are measured. • Residuals r, are computed as the difference between the observations y, and the predicted normal behavior ŷ. • Non-zero residuals imply that there is a fault in the system and this triggers the diagnosis algorithm.
Types of Faults • Incipient Faults • Occur slowly over time • Linked to wear and tear of components and drift in control parameters. • Intermittent Faults • Present only for very short periods in time • Could have disastrous consequences in time • Abrupt Faults • Dramatic and persistent • Cause significant deviations from steady state operations-Transients
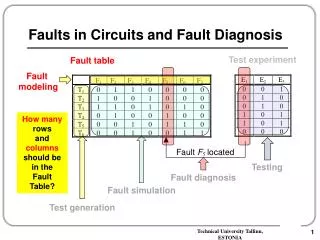
Steps in Fault Diagnosis • Fault Detection- signaled by a non zero residual • Fault Isolation • Qualitative Fault Isolation • Hypothesis Generation- Back Propagation Algorithm • Generating Fault Signatures- Forward propagation Algorithm • Progressive Monitoring • Quantitative fault Isolation • Parameter Estimation
Modeling For Diagnosis • The models should describe both normal and faulty system behavior. • The model should generate dynamic behavior under faulty conditions, so fault transients can be predicted by the model. • The model should incorporate sufficient behavioral details so that deviations in observed variables can be mapped back to system components and parameters.
Temporal Causal Graph • Dynamic Characteristics of system behavior derived from the bond graph are represented as a temporal causal graph • Algorithms for monitoring, fault isolation and prediction are based on this representation. • It is derived from the bond graph model. • Incorporates cause effect relationship among the power variables shown in the bond graph. • Component parameters and temporal information are added to individual causal edges.
Transient Analysis Our approach analyze measurements individually. Transient Response of a signal (can be approximated by Taylor series of order k) y(t) = y(t0) + y'(t0)(t- t0)/ 1! + y''(t0)(t- t0)2/ 2! + …… + y(k)(t0)(t- t0)k/ k! + Rk(t), where Rk(t) is the remainder term based on y(k+1)(t). Signal transient due to a fault at t0 can be expressed as discontinuous magnitude change, y(t0), plus first and higher order derivative changes, y'(t0), y''(t0), ….., y(k)(t0).
Derivation of TCG from Bond Graph • Effort and flow variables are vertices • Relation between variables as directed edges • =implies that two variables associated with the edge take on equal values, 1 implies direct proportionality,-1 implies inverse proportionality. • Edge associated with component represents the component’s constituent relation.
Backward Propagation + Above Normal - Below Normal 0 Normal
Fault Prediction-Establish Signature for system variables • The prediction module uses the system model to compute the dynamic, transient behavior of the observed variables and the eventual steady state behavior of the system under fault conditions. • Future behavior is expressed in qualitative terms:magnitude(0th order), slope(1st order) • The algorithm used propagates the effects of a hypothesized fault to measure a qualitative value for all measured system variables. • Forward propagation along temporal edges implies an integral effect, the cause variable affects the derivative of the effect variable. • Algorithm stops when signature of sufficient order is generated. • Order depends on set of chosenmeasurement variables & desired level of “diagnosability”.
Monitoring Implementation • Progressive Monitoring to track system dynamics after failure • Higher-order derivatives as a predictor of future behavior (justified by Taylor’s series) • Activated when there is a discrepancy between predicted and observed value.
Diagnosability of a system • Diagnosability is a function of the number of possible faults that can be uniquely identified by a fault isolation system. • Completely Diagnosable system- A system which can uniquely isolate all possible hypothesized faults. • Depends on selected observation set and chosen order of their signature. • Consideration of higher order variable effects is likely to result in greater diagnosability. • same diagnosabilty can be achieved- by considering higher order signatures but smaller number of total observations or using a large number of observations with lower order signatures.
Two Tank SystemResponse to Faults f5: Faults: Rb1, Rb2, R12 Discontinuity Faults: C1, C2 Discontinuity It seems one measurement is enough but not really…. (especially if analysis is qualitative) & discontinuities not reliably detected...
Progressive Monitoring • Monitoring involves comparing predicted signatures of the hypothesized faults to actual measurements as they change dynamically. • Choice of monitoring time step is vital-neither too low or too small • Transient characteristics at the time of failure tend to change over time as other phenomena in the system affect the measured variables. • Ex: A fault may have no effect on initial magnitude(0th order) of a variable but it may affect its 1st derivative(slope), predicting that it will be above normal. • Therefore immediately after fault occurs, variable value will be observed to be normal , but as time progresses, the derivative effect will cause the variable to go above normal. • This notion of employing higher order derivatives – Progressive Monitoring.
Limitations of Purely Qualitative Schemes • For the case where a signal does not undergo abrupt change, higher order derivatives beyond the first non-zero derivative have no discriminatory power. • Consider 2 faults with second order signatures-(0,+,+) and (0,+,-) for a particular measurement. • signal shows no discontinuous change at point of failure, matches (+,+,.) • Even if signal slope is measured to be -, the (+,+,+) cant be eliminated as a higher order derivative not captured in the second order signature could be -. So faults cant be isolated. • Solution- Quantitative diagnosis.
Parameter Estimation Consider system defined by C1- and R12+ are the fault candidates. Estimate the parameter by substituting the nominal values values for the variables in the I-O model of the system. If the error e converges to 0, for a particular parameter, that parameter is the fault