Download
1 / 20
200 likes | 323 Views
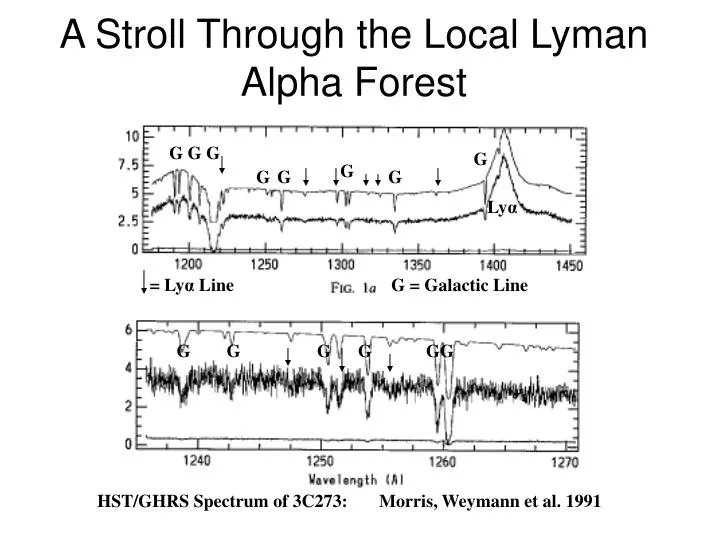
A Stroll Through the Local Lyman Alpha Forest. G G G. G. G. G. G. G. Ly α. = Ly α Line. G = Galactic Line. G G G G GG. HST/GHRS Spectrum of 3C273: Morris, Weymann et al. 1991.

E N D
A Stroll Through the Local Lyman Alpha Forest G G G G G G G G Lyα = Lyα Line G = Galactic Line G G G G GG HST/GHRS Spectrum of 3C273: Morris, Weymann et al. 1991
QSO ABSORBER GALAXY ASSOCIATIONSFINDS THE KEYS AT THE LOWEST REDSHIFTS COLORADO GROUP: JOHNSTOCKE, MIKESHULL, STEVEPENTON, CHARLESDANFORTH, BRIAN KEENEY ALUMNI: MARKGIROUX (ETSU), JASON TUMLINSON (YALE), JESSICA ROSENBERG (CfA), MARY PUTMAN (MICHIGAN), KEVIN McLIN (Sonoma State) ELSEWHERE: RAY WEYMANN (NIRVANA), J. VANGORKOM (COLUMBIA), CHRIS CARILLI ( NRAO) Results based on: >200 QSO ABSORBERS found by HST Spectrographs at z <0.1 and at low column densities (NHI =1012.5—16.5 cm-2 ) AND > 1.2 Million galaxy locations and redshifts from the CfA galaxy redshift survey, 2DF/6DF, SLOAN Digital Sky Spectroscopic Survey (DR-4), FLASH & others, including our own pencil-beam surveys
: (Nicastro et al. 2005)
SUMMARY OF STATISTICAL RESULTS • COSMIC BARYON CENSUS: WLy a /Wbaryon = 29 ± 4 % (most of the mass is in the low column density (NHI < 1014 cm-2) absorbers) • Wb(voids)/ Wb = 4.5 ±1.5% AS PREDICTED BY SIMULATIONS (Gottlöber et al 2003); • At least 55% of all Ly α absorbers with NH I > 1013 cm-2 are METAL-BEARING at ~ 10% SOLAR ( based on O VI and C III detections with FUSE ) • Spread of metals from nearest L* galaxies: 150—800h-170kpc but L* galaxies probably not primary source of metals. • A typical galaxy “filament” is > 33 - 50 % covered by ~ 10% SOLAR gas. • For details see PENTON et al. (2000a,b, 2002, 2004) ApJ (Ly alpha absorbers) and STOCKE et al. (2006) ApJ, 641, 217 (OVI absorbers)
THE IGM BECOMES MORE STRUCTURED AND HETEROGENOUS WITH TIME The 33% Solution ! Galaxies Warm IGM (Lyα Forest) Warm-Hot IGM (WHIM) From Dave’ et al. 1999
IGM Gas without feedback from Galactic Superwinds YELLOW: T > 106 oK (OVII/OVIII WHIM) RED: T=105--6 oK (OVI WHIM) GREEN & BLUE: T=103.5--5 oK (Warm IGM: Lyα Forest) IGM Gas WITH Galactic Superwind Feedback This prescription requires that feedback is proportional to the local star formation rate, and thus mass density per pixel) (** This maybe an incorrect prescription) Simulation finds 50% of local IGM in WHIM gas Cen & Ostriker 2005 astro-ph/0601008 and Cen & Fang 2005 astro-ph/0601009 30 h-170 Mpc
TWO-POINT CORRELATION FUNCTION (TPCF) AMPLITUDE GALAXY-GALAXY TPCF SHOWS EVIDENCE FOR SUPERCLUSTER FILAMENTS AT Δ V < 600 km/s AND VOIDS AT Δ V > 1000 km/s Ly α ABSORBER-ABSORBER TPCF ALSO SHOWS EXCESS ( 7σ LEVEL) DUE TO FILAMENTS AT Δ V < 600 km/s. (UPPER-RIGHT) LOWER LEFT PANEL SHOWS THAT THIS EXCESS IS DUE ENTIRELY TO STRONGER Ly α LINES (NHI > 1013 cm-2). LOWER LEFT PANEL ALSO SHOWS A HINT OF VOIDS (deficit at larger ΔV). O VI ABSORBERS WITH Ly α LINES IN PAIRS CAN ACCOUNT FOR THIS ENTIRE EXCESS. THE LOWER-RIGHT PANEL SHOWS THAT WEAKER Ly α ABSORBERS SHOW NO EVIDENCE FOR CLUSTERING IN SPACE
MATTER DENSITY IN COSMIC VOIDS • When corrected for pathlength surveyed, 22% of Lyα absorbers are in galaxy voids • Statistically lower N(H I) absorbers in voids • If Lyα absorbers are only mass in voids then: Ωb(voids)/ Ωb(total) = 4.5 ± 1.5% • If these absorbers have the cosmic fraction of baryons to dark matter then this density agrees with the mean density at the center of voids found in simulations. • Also, we have searched the void regions around Lyα absorbers and found no H I in bound halos down to 108 M (Solar) in 30 Mpc3 • This absence of dark matter halos is not stringent enough to be inconsistent with simulations. ● Figure from Gottlöber et al. 2003 MNRAS 344, 715
METALS IN VOIDS: WHY INTERESTING?COMPOSITE SPECTRA OF HUNDREDS OF HIGH-Z ABSORBERS FINDS [Z]= -2 TO -3 • Pixel-addition techniques for NH I < 1015 cm-2 absorbers finds C IV, Si IV and OVI consistent with wide-spread low metallicity throughout the diffuse IGM (Cowie etal. 1995; Simcoe, Sargent & Rauch 2004; Pieri, Schaye & Aguirre 2006). • No evidence for a metallicity “floor” since 20—40% of absorbers at NH I > 1013.6 cm-2 have [Z] < -3 (Simcoe, Sargent & Rauch 2004). • Some evidence that mean absorber metallicity is higher near highly-enriched regions (as marked by C IV absorbers) but the correlation with bright galaxies (Lyman break galaxies) is not nearly so strong. (Pieri, Schaye & Aguirre 2006).
IS THERE METAL-ENRICHED GAS IN VOIDS? BEST CURRENT LIMITS [Z] < -2.7 SOLAR BASED ON 7 VOID ABSORBERS WITH BOTH STIS & FUSE SPECTRA: Log U = -1.5 to -1 expected for low-z
IS THERE METAL-ENRICHED GAS IN VOIDS: IICOLLISIONALLY-IONIZED MODELS FOR DIFFERENT WHIM TEMPERATURES
COSMIC ORIGINS SPECTROGRAPH: TO BE INSTALLED DURING SHUTTLE SERVICING MISSION #4 IN MAY, 2008
EXAMPLES OF ``COSMIC ORIGINS SPECTROGRAPH’’ GUARANTEED TIME OBSERVATIONS TO BE MADE LATE IN 2008 The Extent, Metallicity and Kinematics of a Normal, Luminous (~L*) Spiral Galaxy Using multiple QSO sightlines
QSO TOMOGRAPHY OFTHE GREAT WALL & LOW-Z VOIDS (8 DEGREE WIDE WEDGES)
CONTOURS OF LOCAL GALAXY DENSITY IN GREEN BRIGHT QSO SIGHTLINES IN PINK
MEDIAN DISTANCE TO NEAREST GALAXY Sample Distance in Sample Name h-170 kpc Size • L* Galaxies : 350 500 • O VI Absorbers in Ly α Pairs: 200 10 • O VI Absorbers : 290 23 • Stronger half Ly a Sample : 450 69 • Weaker half Ly a Sample : 1850 69 --------------------------------------------------------------------- • Simulations of WHIM GAS : 200 Dave’ et al • Simulations of Photo-ionized Gas: 1200 (1999) ---------------------------------------------------------------------- from Stocke et al. 2006 ApJ 641, 217 astro-ph/0509822
SUMMARY OF STATISTICAL RESULTS • COSMIC BARYON CENSUS: WLy a /Wbaryon = 29 ± 4 % (most of the mass is in the low column density (NHI < 1014 cm-2) absorbers) • ASSOCIATION WITH GALAXIES? 78% LOCATED IN SUPERCLUSTER FILAMENTS; 22% IN VOIDS. STRONGER absorbers at NH I > 1013 cm-2 are more closely ASSOCIATED WITH GALAXIES WEAKER absorbers are more NEARLY UNIFORMLY DISTRIBUTED in space. • Wb(voids)/ Wb = 4.5 ±1.5% AS PREDICTED BY SIMULATIONS (Gottlöber et al 2003); • **At least 55% of all Ly α absorbers with NH I > 1013 cm-2 are METAL-BEARING at ~ 10% SOLAR ( based on O VI and C III detections with FUSE ) • ** O VI and CIII-bearing absorbers indicate spread of metals from nearest L* galaxies: 150—800h-170 kpc; median distance to L* galaxies (350h-170 kpc) too small for them to dominate metal-enrichment (Tumlinson & Fang 2005 ApJ) L < 0.1L* galaxies must contribute significantly to metal enrichment of IGM. • A typical galaxy “filament” is > 33 - 50 % covered by ~ 10% SOLAR gas. • For details see PENTON et al. (2000a,b, 2002, 2004) ApJ (Ly alpha absorbers) and STOCKE et al. (2006) ApJ and astro-ph/0509822 (OVI absorbers)
Why study the diffuse gas in the Inter-Galactic Medium (IGM)? . Traces the dominant matter reservoir. Most of the baryons in the local Universe are not in galaxies but rather in the IGM • Probes voids in the galaxy distribution. Lyman α absorbers are the only baryons detected thus far in galaxy voids. • Traces the evolution of large-scale structure with little bias • Probes diffuse galaxy halos and winds: Do Starburst Winds escape? How much and how far away do they enrich the IGM? • Measures the evolution of metallicity with redshift