Download
1 / 25
250 likes | 403 Views
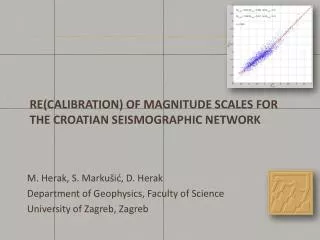
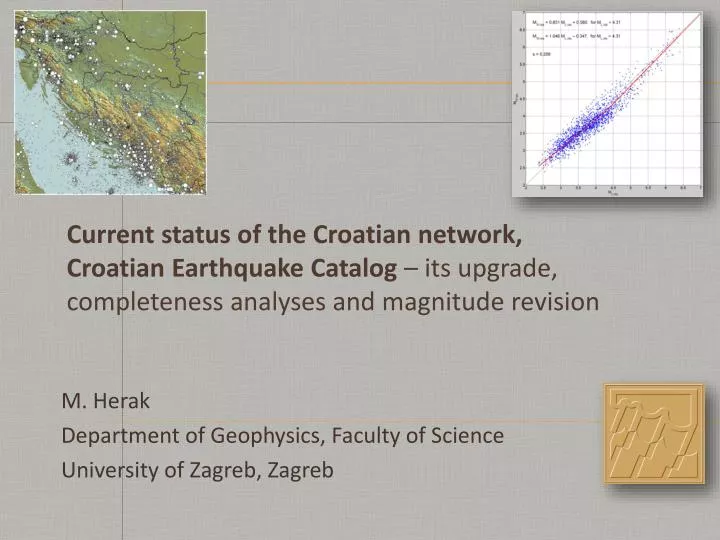
M. Herak Department of Geophysics, Faculty of Science University of Zagreb, Zagreb. Current status of the C roatian network , Croatian Earthquake C atalog – its upgrade, completeness analyses and magnitude revision. Croatian Seismographic Network.

E N D
M. Herak Department of Geophysics, Faculty of Science University of Zagreb, Zagreb Current status of theCroatian network,Croatian EarthquakeCatalog – its upgrade, completeness analyses and magnitude revision
Croatian Seismographic Network • In the last 12 years the network has been significantly upgraded... • The network consists of: • 21 BB stations (20 x Guralp, 1 STS-2) • 10 strong motion instruments (ETNA, Guralp, GEOSIG) • 3 BB stations scheduled for 2013. • Problems: permissions, repair, financing... • The future? Severe financial cuts make me a bit pesimistic...
Croatian Seismographic Network • All BB-stations transmit the data to Zagreb in real-time. • We use: • Dedicated lines (CARNet) • ASTRA satellite internet connection • EUTELSAT satellite internet connection • ADSL • Mobile internet • ASTRA will soon replace all EUTELSAT stations – much more stable, and MUCH cheaper...
Croatian Earthquake Catalogue The catalog lists earthquakes in Croatia and adjacent regions since 373 BC. Today – more than 55000 earthquakes. Events are added at a rate of about 8000/year. We routinely analyse and locate all events in Croatia, Bosnia and Herzegovina and most of Slovenia. • The most active are: • Greater Zagreb area (NW Croatia) • Croatian Primorje • Dalmatia
Croatian Earthquake Catalogue Spatial completeness, by year 1850. 1925.
Croatian Earthquake Catalogue Spatial completeness, by magnitude M = 4.0 M = 3.0
Croatian FPS database • 216 solutions • 1909–2012 • Excel-database • 161 FPS computed by us (first motion polarity) • 6 by CMT Harvard, MEDNET, ZUR_RMT • 31 by Pondrelli et al. • 18 by ARSO, Slovenia
Croatian FPS database • P-axis (horizontal projection) – only quality 2 and better • Tectonic stresses are directed SW–NE (in the southern and eastern regions) to S–N (in the northern and western parts). • This reflects counter-clockwise motions of Adria and its compression against the Dinarides. • Most of solutions indicate reverse or strike-slip faulting.
Croatian Earthquake Database • Accumulation of all kinds of seismicity-related data prompted an initiative to form a relational database which would enable easy acces and management of: • Earthquake catalogue (>55,000 records in 2012.) • Fault-plane solutions (216 earthquakes) • Macroseismic datapoints (380 events) and maps archive • Phase readings for all analysed earthquakes (>35,000 files with over 500,000 phase readings) • Digital seismograms • Strong-motion data
Croatian Earthquake Database – Queries • Earthquake catalogue • Table of relations • Macroseismic catalogue Earthquakes felt in Samobor
Croatian Earthquake Database – Queries Ston - Slano 5 Sep. 1996 M = 6.0 Imax = VIII MCS
Croatian Earthquake Catalogue The first major catalogue revision was done in 1996 (Herak et al. in Terra Nova), when all available primary data were used to relocate most instrumentally located earthquakes. Since then a lot has changed, and new revision is underway. In particular we want to relocate all events for which instrumental data exist using improved velocity models and station corrections and revise the magnitudes...
Magnitudes – history and motivation... The first magnitude calibration in Croatia was done by D. Skoko in his Ph. D. dissertation in 1969. Two calibrating functions for recordings on 1000 kg Wiechert horizontal seismograph were derived – for distances of 2.2˚–20˚, and 20˚–170˚. In the ‘Balkan project’ (1974), a new formula was derived. It was retained even after introduction of electromagnetic and digital seismographs: After a significant enlargement of the network in the few first years of the 21st century, Futač (2007) checked its appropriatness, and concluded that data do not indicate the need for change. As digital high-quality data accumulated, it became clear that the formula does not work well for short distances, significantly underestimating the magnitude. This prompted recalibration of the ML-scale. The need to use moment magnitudes in hazard analyses, motivated efforts to routinely observe also Mw thus initiating this work.
Goals and earthquakes • Goals: • Calibration of MLand MWA using recent digital data from the Croatian Seismographic Network, and • Introduction of an automatic routine procedure for determination of MW using spectral analyses of local and regional earthquakes recorded by the Croatian Seismographic Network • Selection of earthquakes: • Events from the Croatian Earthquake Catalogue satisfying any of the following: • Year > 2002 • M > 2.5 & D < 200 km (for any station) • M > 3.0 & D < 300 km (for any station) • M > 3.5 & D < 400 km (for any station) • M > 4.0 & D < 500 km (for any station) • M > 5.0 & D < 700 km (for any station) • 11900 3-component BB seimograms found!
Goals and earthquakes 1. Determination of seismic moment (M0) and moment magnitude (Mw) The source displacement spectrum looks like: v – velocity of seismic wavesf – frequency f0 – corner frequency – density low frequency spectral level amplitude corner frequency, f0 frequency
M0 and Mw 1. Determination of seismic moment (M0) and moment magnitude (Mw) Displacement spectrum at receiver at the epicentral distance : – near surface attenuationQ – quality factor (for P or S-waves) RP – average radiation pattern coefficient ( 0.6) FS – free surface amplification ( 2 for SH) G = 1/gd – geometrical spreading function, gd – geodistance If we know (or invert for!) attenuation (, Q), and assume reasonable values representing the effects caused by the radiation pattern, free surface amplification and geometrical spreading, we can fit the formula to the observed spectrum and get the scalar seismic moment (M0), and then compute the moment magnitude: Mw= 2/3 log(M0) – 6.07
M0and Mw 1. Determination of seismic moment (M0) and moment magnitude (Mw) Determine theoretical onset times of Pg, Pn, Sg, Sn. LP-filter, read max. S-wave amplitudes. Wood-Anderson filter, read max. S-wave amplitudes Determine the windows for: noise, P-waves, S-waves. Compute spectra, smooth, correct for the instrument and noise. Fitting theoretical curve to spectra for P- and S-waves yields estimates for: Q(f),, f0, M0, both for P- and S-waves Compute MW as average of MW(P) and MW(S) Save everything, next earthquake S-waves P-waves
M0 and Mw; ML and MWA 2. Calibration of ML and the Wood-Anderson magnitude MWA Compute MLand MWA for every recording (all stations) using the best calibrating function so far, in the form: Compute representative earthquake magnitude for all events for which at least three magnitude estimates exist as the median of the station magnitudes. Check if there is any distance dependence – if yes adjust coefficients observing all possible constraints (e.g. anchoring of MWA at 100 km). Compute station corrections (SC) and start again... The best estimates are:Amax is the trace amplitude in nm on the simulated Wood-Anderson seismograph (magnification 2080). This is the same MWAformulaas obtained for Central Europe by Stange (2006).
M = (Station magnitude) – (Earthquake magnitude) vs. time MWMLMWA MWMLMWA
M = (Station magnitude) – (Earthquake mgnitude) vs. time MWMLMWA MWMLMWA
M0and Mw – results MWS Corner frequency vs MW Individual (station) magnitudes MWS S-waves P-waves Earthquake magnitudes MWP
M0 and Mw; ML and MWA (Event magnitude) – (Station magnitude) (with added station corrections)
Relationships... Individual (station) magnitudes Earthquake magnitudes MW vs. MWA ML vs. MWA MW vs. ML
Station corrections Sta MLMWAMwSMwP ---------------------------- KIJV 0.02 0.06 -0.03 -0.03 CACV 0.04 0.06 -0.12 -0.08 PTJ 0.09 0.06 -0.05 -0.00 DBR 0.06 0.15 0.01 0.06 STON 0.05 0.08 0.01 0.06 STA 0.10 0.14 -0.01 -0.04 NVLJ 0.05 0.05 -0.05 -0.08 RIY -0.06 -0.12 -0.13 0.02 ZAG -0.27 -0.32 -0.21 -0.16 SLUN 0.06 0.07 -0.05 -0.04 UDBI -0.06 -0.11 -0.12 -0.05 BRJN 0.04 0.04 -0.03 -0.10 SISC -0.40 -0.41 -0.20 -0.24 HVAR 0.04 0.00 -0.02 0.12 MORI -0.04 -0.01 -0.07 -0.08 ZIRJ -0.03 -0.01 -0.03 -0.04 OZLJ 0.15 0.16 -0.13 -0.01 KALN 0.07 0.01 -0.05 -0.03 RIC -0.04 -0.11 -0.18 -0.01 KSY -0.10 -0.11 -0.17 -0.10 SLNJ 0.14 0.04 -0.01 0.14 ---------------------------- The largest (negative) station corrections are found on thick alluvium, in river valleys close to the Pannonian basin. ML station corrections Corrections for the moment magnitudes are smaller than for local magnitudes (!)
Conclusions Croatian BB seismographic network has been steadily increasing in the last decade; however, lack of funding puts this development in jeopardy. Strong-motion network has been largely neglected (lack of funds, again...). Good quality data significantly improved understanding of seimicity in the greater Croatian region. Croatian Earthquake Database is a significant effort towards data oragnization and useability. Magnitude revision which is underway yielded new calibrating functions for local magnitudes (ML and MWA) which produce distance-independent estimates. A procedure for routine computation of moment magnitude using spectra of local and regional earthquakes has been established. The correspondence between the three magnitudes is close to 1:1 relationship. This is encouraging, promising an easy conversion from ML to MW for older events.