Download
1 / 21
210 likes | 525 Views
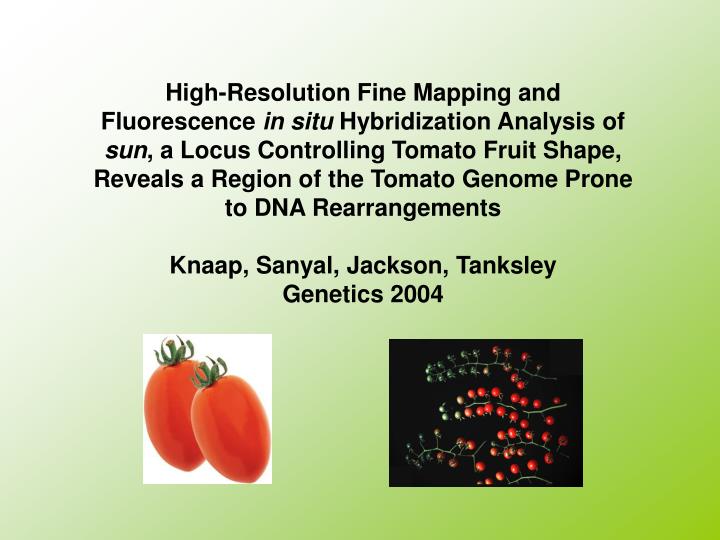
High-Resolution Fine Mapping and Fluorescence in situ Hybridization Analysis of sun , a Locus Controlling Tomato Fruit Shape, Reveals a Region of the Tomato Genome Prone to DNA Rearrangements Knaap, Sanyal, Jackson, Tanksley Genetics 2004 .

E N D
High-Resolution Fine Mapping and Fluorescence in situ Hybridization Analysis of sun, a Locus Controlling Tomato Fruit Shape, Reveals a Region of the Tomato Genome Prone to DNA Rearrangements Knaap, Sanyal, Jackson, Tanksley Genetics 2004
Before we start…..Chromosomal Rearrangements Remarks • Between tomato and potato • 5 major inversions with chromosomes 5, 9, 10, 11, 12 • Between tomato and eggplant • 28 rearrangements • Between Capsicum and the rest • 30 breaks as part of 5 translocations, 10 paracentric inversions, 2 pericentric inversions, and 4 disassociations or associations of genomic regions that differentiate tomato, potato, and pepper • Within the genus of Solanum/Lycopersicon • Few rearrangements
Sun locus implicated in fruit morphology • Sun locus • Short arm chromosome 7 • Controls fruit morphology • Alleles • WT=round shape, Cultivated=oval shape (Roma) • Cloning of genes in fruit morphology • Reveal molecular basis of tomato domestication • Elucidation of developmental pathways • Improvement of fruit quality • Mapping populations created for fine mapping purposes
Mapping Populations for sun • Mapping in tomato • Typically with Introgression Lines • Nucleotide polymorphisms should be high between two parents • Two mapping populations • EPM= L. esculentum Sun1642 x L.pimpinellifolium LA1589 • These two lines are inbred • EPN= L. esculentum Sun1642 x L. esculentum IL7-4 • IL7-4 has segment of chromosome 7 of L. pennellii LA716 • EPN is nearly isogenic in F2 • To reduce effect of minor loci confounding phenotypic analysis and to increase the number of SFPs (chromosome 7 region)
First Round Screening • Line thickness denotes alleles derived from either parent • =selfing of plant • Sun initially mapped in the 100 F2 population • High resolution was performed on the F3s • Recombinants ID’d and analyzed for precise location of sun
A: low resolution map (EPM) B: high resolution map (EPN) C: high resolution map (EPM) Numbers above indicate cM distances, numbers below are number of plants Brackets represent genomic clones
Mapping with EPM and EPN Populations • Work in 2001 mapped sun to this area • EPM population mapped to this area with • the 100 F2s • EPN population high-res mapping • nearly isogenic to reduce effects of minor loci • 3509 EPN F2s resulted in 25 recombination events • within GP121 and TG576 • Lp12L2-F used to screen genomic libraries • Resulted in 8 large genomic clones • Drop in recombination frequency in EPM suggested • a paracentric inversion as a possibility (CT52 & LPT4D21)
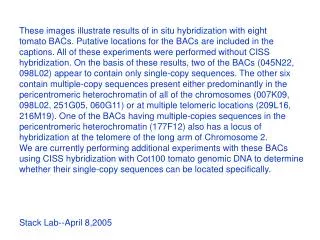
Fluorescent in situ hybridization, FISH Analysis of Sun • Pachytene FISH and Fiber FISH • High resolution mapping of physical distances on the chromosome • Results indicated that clones mapping near the telomere in the EPN population mapped well below the telomere in EPM population • PCR using “telomeric primers” TGR-1 showed that EPN contain subtelomeric repeat TGR-1. EPM lacks this repeat • Results support a paracentric inversion hypothesis
Mapping in the EPM • Lack of recombination events in EPN population made further mapping unsuccessful • Proceeded to map in the EPM population • Still needed to minimize minor loci effects • Use a large F3 population • 1320 plants screened • 234 recombinants identified between Le76E24 & GP121
EPM Mapping continued • F4 families analyzed for variation in fruit size • Overlap in fruit shape indicates presence of minor loci &/or environmental effects • Progeny testing showed sun to be flanked here • Unfortunately no genomic clones available for this region
Concluding Remarks • Sun locus is ~30kb larger in L. esculentum Sun1642 compared to L.pimpinellifolium LA1589 • Allelic variation due to insertion/deletion in this region? • Gene duplication/deletion responsible for dosage effects? • Mapping resolved sun to a 68 kb region • Region appears to be prone to rearrangements • Breakpoint, inversion, deletion/insertion • 15X theoretical coverage • Reason for missing genomic clones • Intrinsic cloning inefficiency, instability of certain fragments • Future work is using phage l genomic libraries to clone sun
The making of a bell pepper-shaped tomato fruit: identification of loci controlling fruit morphologyvan der Knapp and TanksleyTAG 2003
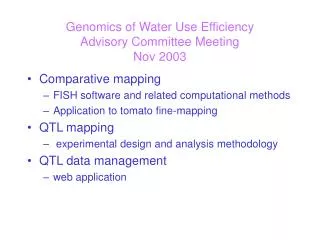
Overview • Significant variation in Lycopersicon esculentum • Fruit shape: round, elongated, pear, hear • Fruit size: grams to 1000 grams • Previous crosses of L. esculentum x wild L. esculentum spp • 15 mapping populations—ID’d QTL controlling shape and size (Grandillo et al 1999) • Fruit was round and slightly elongated and medium • Sought to map the more extreme bell shape phenotype • Relate map positions of some morphology QTL to pepper and eggplant
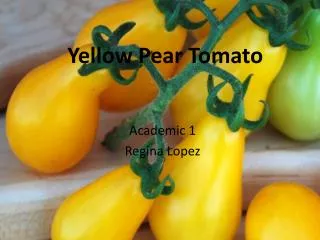
Phenotypic Analysis • L. esculentum cv Yellow Stuffer x L. pimpinellifolium LA1589 200 F2s , 5 of each parent (F1s) planted in randomized design • Measurements • Minimum of 20 fruit per plant • Bell shaped scored visually 1 (round)- 5 (bell) • Fruit mass average of 20 fruit • Total seed weight average of 20 fruit • Locule number • Flower number on three inflorescences per plant • Digital Images
Digital Imaging and Measurements • Stem-end blockiness • x/y • Blossom-end blockiness • y/z • Heart shape • x/z • Elongated shape • w/y • Fruit bumpiness • 10*c/(2pr) Latitudinal sections (x and z) are 10% distance from top or bottom
Markers and Statistical Analyses • 96 RFLP makers obtain across 12 chromosomes • Spanned 1076 cM, average map distance 13 cM • Skewing of alleles for • Chromosome 2, 7, 9, 11 • Commonly observed in populations derived from interspecific crosses • Self-compatibility, gametophytic &/or hybrid viability • QTL mapping with software, QGENE • EE homozygous Yellow Stuffer, PP homozygous LA1589 • Additivity A= (EE-PP)/2 • Degree of dominance D/A • D= EP – (EE+PP)/2
Frequency Histograms • Fruit size and shape distributed continuously • Skewed toward wild parent (LA1589) • Phenotypes controlled by several loci • Wild type alleles confer semi-dominancy • Bell-shape and size correlated r=0.48, p < 0.001 • Common QTL controlling both?
Various Correlations • Fruit size & stem end blockiness, r=0.66 • Fruit size & heart shape, r=0.65 • Fruit size & seeds per fruit, r=0.63 • Bell shape & stem end blockiness, r=0.60 • Bell shape & bumpiness, r=0.42 • Stem end blockiness and bumpiness, not significant
QTL Analyses • 10 QTL for bell shape and fruit size • 40 QTL for potential components of shape and size • Regions affecting bell shape and size also affected one or more components of fruit morphology • Close linkage or pleiotropic effects ?
Simultaneous Fitting of QTL Explain Phenotypic Variation • Bell Shape: bell2.1, 2.2, 8.1 =30% • Fruit Size: fw1.2, 1.2, 3.2, 5.2, 6.2, 7.2 =46% • 5.2 was only novel QTL • Stem end blockiness: sblk1.1, 2.1, 3.1, 7.1, 8.1, 12.1 =34% • Heart shape: hrt1.1, 2.1, 3.1, 7.1 =each 5-9% • Elongated shape: fs 6.2, 9.2 = each 9 % • Bumpiness: bpi 8.1, 9.1, 11.1 = each -9% to 9% • Seed number: (10QTL) =36% • 5 novel QTL • Locule number: lcn2.1 =30% • Flowers per inflorescence: (9QTL)= each 6-19%
Remarks • Most loci controlling shape and size have already been identified • Three previously reported QTL for tomato shape and size • Allelic in Yellow Stuffer • Previous esculentum x pimpinellifolium had different major QTLs controlling fruit size • Fw2.2 vs. fw1.1, 3.2 • Explained by differences in genetic background • Multiple alleles per locus • Coinciding QTL between Yellow Stuffer, bell pepper, eggplant • Selection pressures lead to mutations in at similar loci