Download

1 / 38
380 likes | 381 Views
Explore the aggregate demand model and its implications on inflation, unemployment, and economic growth. Learn about the components of aggregate demand and how shifts in the AD curve impact the overall average price level. Discover the factors that influence consumer spending, investment expenditure, government spending, and net exports, and their effects on AD. Understand the concept of the spending multiplier and its role in stimulating or contracting the economy.

E N D
Aggregate Demand Model AP Macroeconomics
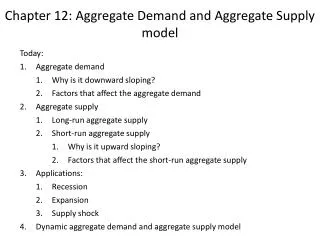
Aggregate Supply & Demand • Simple model of the complex economy • Provides insights on inflation, unemployment, and economic growth
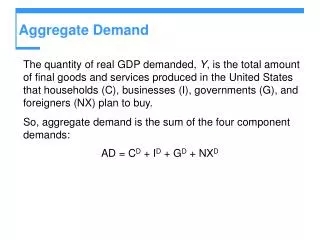
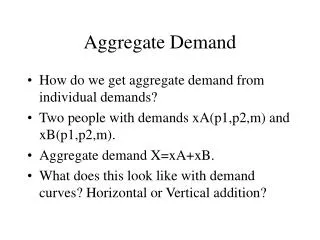
Aggregate Demand • The sum total of all goods and services demanded in the economy (all final markets) • Related to the overall average price level • Formula: AD = C+I+G+(X-M)
Aggregate Demand Curve (and axes) Average Price Level AD 0 Real GDP
Downward-Sloping AD Curve • Different than micro demand curve • Substitutes and Income • Three reasons why the curve is downward sloping: • Real-balance effect (a.k.a. Real Wealth Effect) • Interest-Rate effect • Foreign Purchases Effect
Shifts in the Aggregate Demand Curve Average Price Level AD2 AD Real GDP
Consumption Expenditure (C) Tax rates Expectations: incomes, inflation rate Wage increases Household indebtedness Interest rates Wealth (property, shares, savings, bonds)
Investment Expenditure (I) Expected rates of return Interest rates Expectations of future sales Expectations of future inflation rates Confidence
Net Exports (Xn) • National (foreign) income changes • Exchange rates
AD shifts arising from changes in C • People decide to save more • C falls, AD shifts left • Stock market crash • C falls, AD shifts left • Tax cut • C rises, AD shifts right
AD shifts arising from changes in I • Firms decide to upgrade their computers • I rises, AD shifts right • Firms become pessimistic about future demand • I falls, AD shifts left • Central bank uses monetary policy to reduce interest rates • I rises, AD shifts right • Investment tax credit or other tax incentive • I rises, AD shifts right
AD shifts arising from changes in G • Congress increases spending on homeland security • G rises, AD shifts right • State governments cut spending on road construction • G falls, AD shifts left
AD shifts arising from changes in NX • A boom overseas increases foreign demand for our exports • NX rises, AD shifts right • International speculators cause exchange rate to appreciate • NX falls, AD shifts left
0 White board practice • A ten-year-old investment tax credit expires. • The U.S. exchange rate falls. • A fall in prices increases the real value of consumers’ wealth. • The government decreases veterans’ benefits. • A rising price level decreases the value of money held for purchases. • Consumers expect the job market to be stronger in the next few months. • The stock of physical capital has been falling for nearly a year.
Investment Demand A decrease in the real interest rate will result in more gross private investment r r’ I I’
Expected Future Real GDP, Production Capacity, and Investment Spending An increase in either expected future real GDP or production capacity will result in more investment at the same interest rate r I I’
Average propensity to consume (APC) C/DI APC + APS = 1 C + S = DI S/DI Average propensity to save (APS)
Marginal Propensity to Consume The additional spending that results when a consumer receives additional disposable income. MPS = S/ DI MPC = C/ DI Because DI = S + C, MPC + MPS = 1.
$8 billion $2 billion $10 + $8 = $18 total spending $18 + $6.4 = $24.4 total spending $6.4 billion $1.6 billion Assume MPC is 0.8 $5.1 billion $1.3 billion $24.4 + $5.1 = $29.5 total spending $29.5 + $4.1 = $33.6 total spending $4.1 billion $1 billion $10 billion
M = 1/(1-MPC) Spending multiplier
1/(1-.80) M = 1/(1-MPC) Spending multiplier
1/.2 = 5 1/(1-.80) M = 1/(1-MPC) Spending multiplier
1/.2 = 5 Remember: MPC + MPS = 1 1/(1-.80) Therefore, M = 1/MPS M = 1/(1-MPC) Spending multiplier
$8 billion $2 billion $10 + $8 = $18 total spending $18 + $6.4 = $24.4 total spending $6.4 billion $1.6 billion Assume MPC is 0.8 Multiplier = 5 5 x $10 billion = $50 billion = total effect on the economy’s GDP $5.1 billion $1.3 billion $24.4 + $5.1 = $29.5 total spending $29.5 + $4.1 = $33.6 total spending $4.1 billion $1 billion $10 billion
How is the tax multiplier different than a spending multiplier? Tax multiplier
-MPC/(1-MPC) = -MPC/MPS How is the tax multiplier different than a spending multiplier? Tax multiplier