Download
1 / 30
510 likes | 1.58k Views
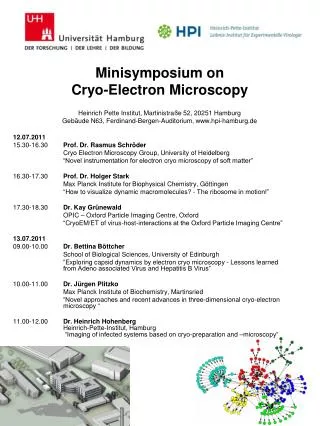
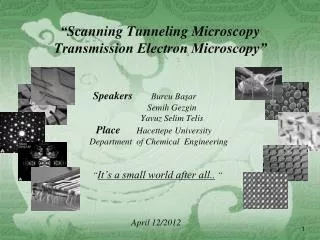
Advanced Transmission Electron Microscopy Lecture 2: Electron Holography by James Loudon. The Transmission Electron Microscope. electron gun. specimen (thinner than 200 nm). electromagnetic lens. viewing screen. Electron Holography. y. x.

E N D
Advanced Transmission Electron MicroscopyLecture 2: Electron Holographyby James Loudon
The Transmission Electron Microscope electron gun specimen (thinner than 200 nm) electromagnetic lens viewing screen
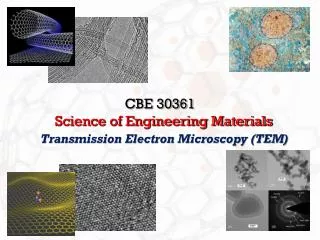
Electron Holography y x • When an electron wave passes through a specimen, its intensity and phase change. • An image records only the intensity and not the phase. • This is unfortunate as the phase contains valuable information about the electric and magnetic fields in the specimen. • The term ‘holography’ is used to describe an imaging technique which encodes the phase information in an image. • There are several methods to produce images which contain the phase information and the main ones will be covered in this lecture. z wavefronts specimen phase shift between the two rays electron wave which went through the specimen electron wave which went through vacuum
y x z wavefronts specimen Electron Holography
The amplitude changes if electrons are ‘absorbed’ i.e. if the number coming out the specimen is fewer than the number that went in. (‘Absorbed’ is used to refer to all the electrons which do not contribute to the image: high-angle scattering also counts as absorption.) y x The specimen exit plane z wavefronts specimen Symbols: f = frequency, t = time, k = wavenumber = 1/l. The phase changes if the electrons move at a different speed or direction through the specimen than through vacuum. Electron Holography A conventional image measures the intensity I(x,y) = |y(x,y)|2 = a2(x,y). The phase, f(x,y), is lost. How can we recover it?
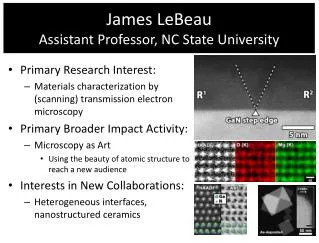
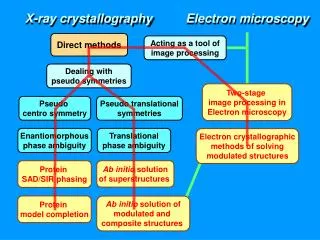
e 200 nm b a c d 200 nm 200 nm 200 nm Examples of E and B-fields Measured using Electron Holography • Semiconductor physics: built-in voltage across a p-n junction. • Nanotechnology: Upper panel: remnant magnetic state in exchange-biased CoFe elements. Lower panel: micromagnetic simulation of the same elements. • Field Emission: Electrostatic potential from a biased carbon nanotube. • Geophysics: Exolved magnetite elements in the titanomagnetite system. • Biophysics: Chains of magnetite crystals which grow in magnetotactic bacteria and are used for navigation Refs: (a) Twitchett et al., J. Microscopy 214, 287, 2003. (b) Dunin-Borkowski R.E. et al., J. Appl. Phys. 90, 6, 2899, 2001. (c) Cumings J. et al., Phys. Rev. Lett. 88, 5, 056804, 2002., (d) Harrison R.J. et al., Proc. Nat. Acad. Sci. 99, 26, 16557, 2002. (e) Simpson E.T. et al., J. Phys. Conf. Ser. 17, 108, 2005.
Magnetic Imaging • In normal operation, the main objective lens of the microscope applies a vertical field of 2T to the sample. • This is obviously undesirable for magnetic imaging and so the objective lens is usually turned off and the diffraction lens which is lower down the column (and is normally used to produce diffraction patterns) is used as an objective lens. • Some microscopes like the Cambridge CM300 and Titan TEMs are equipped with a ‘Lorentz lens’ which has a higher acceptance angle and lower aberrations than the diffraction lens whilst still keeping the sample in a low field. • With judicious fiddling, the specimen can be in a field of <5G.
+ + + + + + + + + + + + + + Obtaining Information from the Phase Geometry for the integrals x electron beam z B Constant determined by acceleration voltage Magnetic flux density specimen S Electrostatic potential f(0) ≡ 0 f(x) Origin of the Mean-Inner Potential Note that the electrostatic potential can either come from specimen charging (not usually what is wanted) or from the mean inner potential, V0, which accounts for the fact that electrons travel faster through material than vacuum. Electric field (or force or acceleration) Electric potential, V Electron beam Electron accelerates Specimen Electron decelerates, returning to its original speed V0 Atomic nuclei z z
t V V0 specimen z t e- z Electrostatic Contribution to Phase Shift – Calculation the same as for a Potential Step Schrodinger equation (E is the energy of the electrons) This is the equation of simple harmonic motion Solution is with So the phase shift is This can be Taylor expanded as E/e= 300kV, V0~ 10V which gives: or, if V is not constant m = electron mass, c = speed of light in a vacuum, l = electron wavelength in the vacuum. The calculation SHOULD BE DONE RELATIVISTICALLY: this changes CE to
q v vx x qx q x z Magnetic Contribution to Phase Shift F = ev×B = ma so a = evB/m and vx=a×time For small deflections, q= vx/v t B q v In general for non-constant B e- SHOULD ALSO BE DONE RELATIVISTICALLY (but in fact all the relativistic bits cancel) Based on Hirsch, Howie, Nicholson, Pashley, Whelan: Electron Microscopy of Thin Crystals
To Reiterate: Geometry for the integrals x electron beam z B Constant determined by acceleration voltage Magnetic flux density specimen S Electrostatic potential f(0) ≡ 0 f(x)
200nm electron gun specimen Lorentz lens interference region electron biprism + Holographic fringes viewing plane Phase Recovery Method 1: Off-Axis Electron Holography Note: many people (including me) use the term ‘holography’ to refer to off-axis holography rather than a collective term for methods to recover the phase. The electron biprism is a positively charged wire placed in the column to interfere electrons which went through vacuum with electrons which went through specimen.
x z The waves interfere How Does Off-Axis Holography Work? +
The phase information now appears in the image …but how do you separate it? Latex spheres (image from Lai et al. in Tonomura et al. (Eds.), Electron Holography, North Holland, Elsevier, Amsterdam 1995.) fringes bend on moving from vacuum into the specimen cosine fringes How Does Off-Axis Holography Work?
Separating the Phase To get the phase, we Fourier transform the intensity and use wrapped phase Inverse Transform SrTiO3 gives amplitude and phase Fourier transform vacuum Original Image (called ‘the hologram’) 100 nm Extract sideband and put origin at centre glue SrRuO3
fwrapped freal 2p 2p x 0 x 0 Extracting the Phase cont. Select sideband Inverse transform sideband The original wavefunction! The spatial resolution of the technique is determined by the size of the mask placed around the sideband. Minor difficulty: the image you recover is the real and imaginary part of the wavefunction. To calculate the phase, you take the inverse tangent (actually arctan2) of the imaginary part upon the real part which gives the phase modulo 2p. So the phase image contains ‘phase wraps’ which must be removed by adding 2p to selected areas of the image. This can be difficult if there are many phase wraps.
Methods for Separating B and V Constant determined by acceleration voltage Magnetic flux density Electrostatic potential In a magnetic sample, the phase will be a sum of electrostatic and magnetic contributions. How can you separate B and V? Method 1: If the specimen has a uniform thickness (t) and composition, the electrostatic term will just be constant: any changes in the phase will be the result of B only.
Separating B and V (cont.) If B is confined to the sample and constant throughout the sample thickness, we can get the component of B normal to the electron beam explicitly as Method 2: If the sample can be heated above its Curie point so that it is no longer magnetic we have See: Loudon J.C. et al. Nature 420, 797, 2002. The magnetic contribution to the phase is then the difference of these two.
Separating B and V (cont.) Method 3: If the magnetisation of the sample can be reversed by tilting the specimen and applying a B-field (usually done using the objective lens which can apply a vertical field of up to 2T), we have: The magnetic contribution to the phase is then: This, of course, relies on being able to exactly reverse the magnetisation. See R.E. Dunin-Borkowski et al., Microscopy Research and Technique, 64, 390, 2004 and refs. therein.
B B Separating B and V (cont.) Method 4: If the magnet is hard so that it tends to stay in a fixed magnetic state, holograms can be taken then the sample removed from the microscope and turned upside down when holograms are taken, remarkably, the magnetic contribution to the phase is reversed but the electrostatic contribution remains the same. Thin Thick Thick Thin Turn over F = -ev× B F = -ev× B Electron beam v v See R.E. Dunin-Borkowski et al., Microscopy Research and Technique, 64, 390, 2004 and refs. therein.
Phase Recovery Method 2: Out-of-Focus Imaging This technique is also known as Fresnel imaging or in-line holography. Unlike off-axis holography, where electrons which pass through the specimen are interfered with those which pass through vacuum, different regions of specimen are interfered by the simple method of taking an out-of-focus image. This is easier than off-axis holography as no biprism is required and the specimen area of interest does not need to be close to the vacuum so the field of view can be much larger - the field of view achievable by electron holography is ~1 mm. The disadvantage is that getting the phase is difficult. It is good for a semi-quantitative overview of the specimen. Example: a specimen with three magnetic domains. In-focus image (blank) Intensity Displacement Out-of-focus image The distance telling you how far out of focus you are is called the defect-of-focus or defocus, Df and is usually measured in mm.
Method 2: Out-of-Focus Imaging (c) (a) Magnetic domain walls in a magnetic thin film (of La0.7Ca0.3MnO3) at a defocus of 1.4 mm and (b) a montage of images at different defoci (Df) (c) Magnetic domain walls in Nd2Fe14B. Taken from S. J. Lloyd et al., Phys. Rev. B 64, 172407, 2001 and J. Microscopy, 207, 118, 2002.
The Transport of Intensity Equation There is a method of obtaining the phase using out-of-focus imaging. It requires two images equally disposed either side of focus and an in-focus image. Combining Schrodinger’s equation with the condition for a steady electron current and re-expressing the answer in terms of the intensity I and phase f gives the Transport of Intensity Equation: This is a non-linear equation and so difficult (but by no means impossible) to solve in the general case. If, however, the in-focus image has a constant intensity, I0 (this depends on the specimen), the equation simplifies to Poisson’s equation which can be solved by Fourier methods.
Simplifying the Transport of Intensity Equation The Transport of Intensity Equation (TIE): If the in-focus intensity is constant I0, we have: Taking the 2D Fourier transform gives: (q is the Fourier space coordinate) So
Using the Transport of Intensity Equation x z z = -Df To obtain the phase, take one image at positive defocus, another image at negative defocus and subtract. Fourier transform, divide the answer by q2 and multiply by all the constants. Inverse transform and you have the phase. z = 0 z = Df
Df = 3mm Df = 0 Df = -3mm Recovered phase cosf Simulated Phase (and cosf) How Well Does TIE Work? Flat, circularly magnetised permalloy elements (J.C. Loudon, P. Chen et al. in preparation.) Note: phase images are often displayed as the cosine of the phase: this gives a contour map where there is a phase shift of 2p between adjacent dark lines. The contour maps also resemble magnetic field lines.
t B q x v mrad e- z mrad Phase Recovery Method 3: Foucault or Phase Plate Imaging When a electron is deflected by a magnetic field, the scattering angle is This is much smaller than the scattering angles for Bragg scattering from a crystal which are several mrad. The effect of a magnetic field is to shift the diffraction pattern.
2q Phase Recovery Method 3(a): Foucault Imaging If several magnetic domains are present, the spots in the diffraction pattern are split. If an aperture is used to block one of the split beams, only one set of domains appear bright. This form of dark-field imaging is called Foucault imaging.
2q Phase Recovery Method 3(b): Phase Plate Imaging Instead of blocking one set of beams, a thin sheet of carbon can be used to induce a phase shift in one of the split beams. For magnetic imaging a phase shift of p should be used. The optimal phase shift depends on the object. For weak phase objects, p/2 is best. After some maths, it can be shown that the resulting image should have black ‘field lines’ with a phase shift of 2p between each. Image has ‘field lines’ Carbon sheet giving p phase shift.
Method 3: Phase Plate Imaging J.C. Loudon, P. Chen et al. in preparation. cos(phase) recovered using TIE. Phase plate image of circular permalloy elements. This method was suggested by A.B. Johnson and J.N. Chapman (J. Microscopy, 179, 119, 1995) for visualising magnetic fields and it is very rarely used. It is also not very clear how to obtain the phase itself from a phase-plate image. Phase plates are more commonly used to enhance the contrast from biological specimens.