Download
1 / 16
160 likes | 299 Views
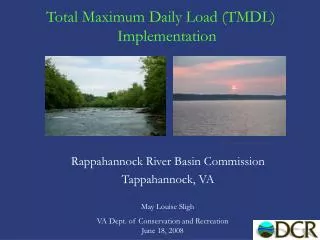
Bacteria and Dissolved Oxygen Total Mass Daily Load Development for the Atascosa River. Jessica L. Watts. WLA. LA. MOS. TMDL Overview.

E N D
Bacteria and Dissolved OxygenTotal Mass Daily Load Developmentfor theAtascosa River Jessica L. Watts
WLA LA MOS TMDL Overview A TMDL is a tool for implementing state water quality standards. It is based on the relationship between sources of pollutants and in-stream water quality conditions. TMDL = LC = WLA + LA + MOS TMDL • where: • LC = loading capacity • WLA = wasteload allocation • LA = load allocation; and • MOS = margin of safety
Components of TMDL Development • Problem Identification • Identification of water quality indicators and targets • Source assessment • Linkage between water quality targets and sources • Allocations • Follow-up monitoring and evaluation • Assembling the TMDL Identification of Water Quality-Limited Waters Assessment of Water Quality-Based Control Actions Priority Ranking and Targeting Implementation of Control Actions Development of TMDLs Natural Water QualityAssessment and Control
Key Questions Considered for Problem Identification • What are the Designated Uses and Associated Impairments of the river? • What Data are readily available? • What is the Geographic Setting of the TMDL? • What are the Exacerbating Characteristics of the river and its watershed? • What are the Pollutant Sources and Pathways? • What temporal considerations affect the TMDL? • How will margin of safety be addressed in the TMDL? • What are some potential control options?
Key Question #1: What are the Designated Uses and Associated Impairments of the River? The Atascosa River’sdesignated uses • Aquatic Life • Subcategory – High • Has NO known Federally Endangered or Threatened Aquatic Species • Contact Recreation • General • Fish Consumption • Public Water Supply
Associated Impairments/2004 Concerns • 25 Miles Surrounding US 281 • Concerns • Contact Recreation Use • Bacteria • Nutrient Enrichment Concern • Ammonia • Algal Growth Concern • Excessive Algal Growth • Public Water Supply • Total Dissolved Solids US 281 • Remainder of Segment • Concerns • Public Water Supply • Total Dissolved Solids • Lower 25 Miles • Concerns • Public Water Supply • Total Dissolved Solids
Information was downloaded from the web, including: EPA Basins: River Reaches Soil Information (STATSGO) Major Roads HUC Boundary Dam Sites Counties Ecoregions Water Quality Monitoring Station Summaries Bacteria Monitoring Station Summaries Weather Station Sites USGS Gaging Stations Clean Water Needs Survey Industrial Facilities Discharge Sites Permit Compliance System Sites and Loadings CERCLIS – Superfund National Priority List RCRIS – Resource Conservation and Recovery Information Systems Mineral Industry Locations USGS Seamless: Aquifers National Elevation Dataset 1992 Land Use USGS – NHD: Points Wells Gaging Stations Flowlines Waterbodies PRISM Precipitation Key Question #2: What Data are readily Available? Readily Available Information
Key Question #3: What is the Geographic Setting of the TMDL? Geographic Settingof theAtascosa River
Key Question #4: What are the Exacerbating Characteristics of the river and its watershed? Land Use
Key Question #5: What are the Pollutant Sources and Pathways? Point Source Pollutant Sources Legend 1 CERCLIS - Superfund 6 NPDES 11 Industrial Facilities Discharge 40 Mineral Industry
Pollutant Pathways Use of GIS in Pollutant Transport Modeling
B A C D E HSPF HSPF F How GIS Fits Into BASINS& the TMDL Process Landuse and pollutant specific Data Landscape data Meteorological Data Point Sources Windows interface GIS Landuse Distribution Core Model Stream Data Post Processing CH2MHILL
Atascosa Subwatershed Creation Used a Threshold of 60 to create 33 Catchments • 2 Gaging Stations and • Outlet • _____________________ • 36 Subwatersheds
What’s Next • BASINS Predefined Delineation Process • Shapefiles and Tables • Subbasins • Streams • Outlet
Acknowledgements Dr. David Maidment Nate Johnson Carrie Gibson Questions? Picture by: James Hindes http://www.pbase.com/jhindes/the_river