Download
1 / 26
260 likes | 343 Views
EEA Neighbourhood project - Presentation to workshop on real time data exchange and forecast in Europe. 7 – 8 April 2005. EEA strategy 2004 – 2008. An extensive geographic Internet portal to regional and selected localised information will be made available.

E N D
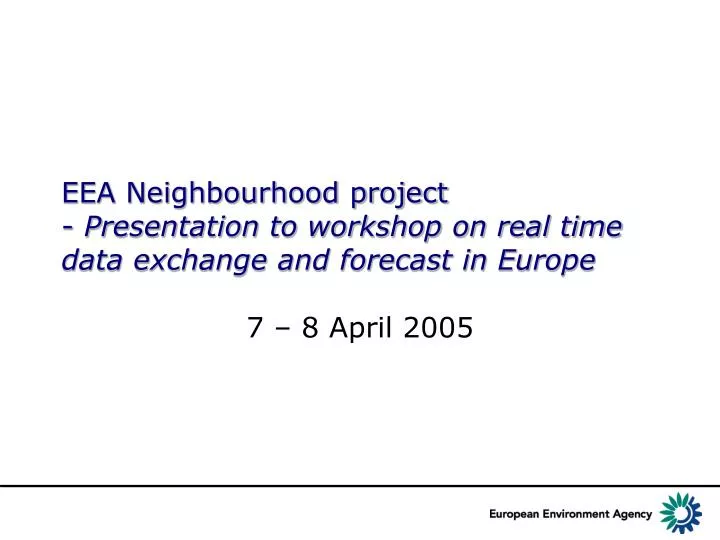
EEA Neighbourhood project- Presentation to workshop on real time data exchange and forecast in Europe 7 – 8 April 2005
EEA strategy 2004 – 2008 An extensive geographic Internet portal to regional and selected localised information will be made available. The objective is to enable the public to locate information about their surrounding environment. By simply entering postal codes or by using interactive maps and tools, people will be able to find information on environmental conditions (…). The system will contain a variety of historical and real-time data on environmental quality.
My Home EPER energy site EPER chemicals Barseback –30Km Tank farm Main flight paths (stacks over Helsingor and Koge bay) traffic EPER energy site munitions shipping Prevailing wind Natura 2000
DIY Neighbourhood conclusions • Numerous data sources; • Numerous ways to present data; • Not yet clear what user focus is; • Very easy to overload users with information; • Very easy to duplicate what is being done elsewhere.
The EEA communication triangle EEA Policy makers What is going on in the environment? Public
What is the EEA vision? • Env info in spatial context for public; • Benchmarking from local to EU level; • Making better use of reported EU data; • Improving exchange of data; • Linking to other providers; Warehouse views Portal
The Neighbourhood and INSPIRE • Neighbourhood can be seen as an INSPIRE Pilot • Neighbourhood will be integrated into EEA SDI • INSPIRE Policy priorities include 6EAP Air quality strategy (CAFE)
Project focus in 2005 • prototype on flood risk mapping methodologies; • focus groups and user expectations; • air quality website; • background data; • data exchange and links; • communication (EEA, Management, Eionet, countries, public); • SDI capacity and functionalities.
Prototype on flood risk - Objectives The prototyping exercise will: • Give a thematic focus to the project in initial stages • test data collection and cooperation with countries and other organisations; • develop and test systems, processes, spatial infrastructure and web GIS mapping; • create awareness and understanding of the Neighbourhood project within EEA networks and wider audiences.
Stage 3 prototype – Air quality • Build on ozone web experience; • Get near real-time data in and out; • Improve interface; • Align functionality with real-life requirements; • Integrate into the EEA’s SDI; • Get started with web services;
Information mandate • Up-to-date information on ambient concentrations of SO2, NO2, NOx, PM, Pb, benzene and O3 shall be routinely made available to the public and appropriate organisations. • Exchange of information about ozone episodes and exceedences of limit values. EU: 1999/30/EC Art. 8 (1), 2000/69/EC Art. 7 (1), 2002/3/EC Art. 6 (1)
The vision • Neal real-time monitored air quality data with European coverage (t0 – -t24 months) • Build capacity: points interpolation and dynamic time series; • European perspective with benchmarking to EU limit values; • Start-point to navigate to other resources (portal).
Ozone prototype and EFNET • Many links to workpackage 2; • Scoping work and knowledge already exists in Eionet; • Data aqcuisition processes and issues understood; • Considerable potential to create synergies.
EPER energy site EPER chemicals Barseback –30Km Tank farm Main flight paths (stacks over Helsingor and Koge bay) traffic EPER energy site munitions shipping Prevailing wind Natura 2000 Questions
First steps - Deliverables in 2005 • Scoping paper neighbourhood project ( February) • Prototype web site on flood risk information (Oct) • Working paper Feasibility study (Oct) • Flooding: Support and process documentation to support extension to further countries (Dec) • Plans and preparation to translate and create a fully operational website integrated into the EEA site (Dec) • Processes to ensure continuity of the service at an operational level (Dec) • Improved real time air quality website (Dec)
Project organisational structure Project team
Neighbourhood project stages Stage 1 3/2005 Stage 2 10/2005 Stage 3 4/2006 Stage 4 11/2006 Stage 5 5/2007 Stage 6 9/2007 Stage 7 3/2008 Stage 8 9/2008 • Stage 8 Operational system (9/2008) • bug fixing and system optimisation continues; • Quality feedback implemented; • translated content is compiled in the system • system is made operational - ready to be launched. • Stage 5 Top10 prototype and key EU datasets (5/2007) • web prototype of Top10 priorities; • Identification of framing and explanatory content; • functionalities and user interface tested; • Key EU datasets in EEA’s SDI for processing and display in prototype; • SDI operational capacities increased. • Stage 4 Top10 desktop (11/2006) • Desktop Arc GIS version of priority functionalities • Water quality content (Eurowaternet/ WISE / WFD) • Improved air quality prototype (translation / data connectors) • Priority EU datasets in SDI • Data exchange requirements confirmed • Data management system in place • Stage 1 Initiation (3/2005) • Set up the project approach and scope of work • Set up the project team • Visit countries • Get contractors in place • Start up flood risk mapping • Stage 2 feasibility and flood prototype (10/2005) • Undertake a feasibility study • Complete a prototype on flood risk mapping methods • Prepare background data • Initiate cooperation with countries • Prepare ozone prototype (data exchange connectors, etc) • Stage 3 Air quality and user requirement analysis (4/2006) • Define user requirements • Analyse user requirements • Complete a prototype on ozone/air quality • Prepare datasets • extend cooperation with countries • Stage 7 test system (3/2008) • systems tested for robustness and stability; • quality reviews carried out; • text content and user interfaces are finalised; • text is dispatched for translation; • Change requests limited, bug fixing undertaken. • Stage 6 Links and Geoportal (9/2007) • compile content • implement automated data exchange protocols with users and providers. • EEA data is published; • EU datasets are published in test environment. * time
Stage characteristics Chunks of work with management decision points: • stepwise approach; • build capacity; • develop a prototype; • develop data exchange or acquisition; • provide communication opportunities; • develop cooperation. scope next stage
EEA business case – rationale for project • Interactive / graphic presentation of environmental information; • spatial context to information at relevant scales; • channel for communication with wider public; • mechanism to improve data use; • a platform for disseminated data exchange and visualisation; • support EEA and member country on Århus Convention.