Download
1 / 16
160 likes | 283 Views
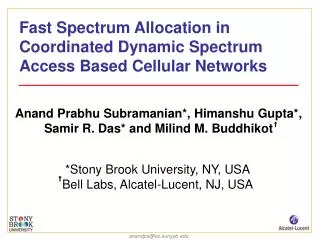
Fast Spectrum Allocation in Coordinated Dynamic Spectrum Access Based Cellular Networks. Anand Prabhu Subramanian*, Himanshu Gupta*, Samir R. Das* and Milind M. Buddhikot. *Stony Brook University, NY, USA Bell Labs, Alcatel-Lucent, NJ, USA. Rigid specification of usage parameters

E N D
Fast Spectrum Allocation in Coordinated Dynamic Spectrum Access Based Cellular Networks Anand Prabhu Subramanian*, Himanshu Gupta*, Samir R. Das* and Milind M. Buddhikot *Stony Brook University, NY, USA Bell Labs, Alcatel-Lucent, NJ, USA
Rigid specification of usage parameters eg: technology, power,etc Current state-of-the-art in Spectrum Allocation Multi-year license agreements Static Allocation • Goal: • Break the Spectrum Access Barrier • Enable networks and end user devices todynamically accessvariable amount of spectrum on a spatio-temporal scale Spectrum is access limited rather than throughput limited
Spectrum Pricing, Allocation Algorithms And Policies Regional Spectrum Broker CPE Internet CPE Spectrum Demand and Allocation 802.16 802.16a CPE CPE CPE Region R2 Region R1 CPE CPE CPE Region R3 MN Region R4 MN Cellular Networks Fixed Wireless Access Mesh Networks Coordinated Dynamic Spectrum Access (CDSA) Model
Contributions • Formulate the Spectrum Allocation problem in the CDSA model as two optimization problems • Max-Demand DSA • Min-Interference DSA • Design fast and efficient algorithms with provable performance guarantees
Spectrum Broker Demands: (dmin, dmax) Coordinated Access Band Spectrum Allocation – Reference Architecture A region R controlled by the Spectrum Broker Batched Demand Processing Model Base stations of different RIPs
1 13 2 21 22 7 6 23 24 25 17 18 19 8 9 10 26 27 20 Interference Constraints 11 12 14 15 16 Remote Cross Provider Constraint Co-located Cross Provider Constraint 3 4 5 Different RIPs
Soft Hand-off Constraint 1 13 2 21 22 7 6 23 24 25 17 18 19 8 9 10 26 27 20 Interference Constraints 11 12 14 15 16 3 4 5 Different RIPs
2 4 5 1 3 6 7 10 8 11 12 9 Base stations of different RIPs Interference Graph 2 1 4 5 Spectrum Allocation 3 Variation of Graph Coloring 6 • Cannot always find a feasible solution • Formulate as optimization problems • Max-Demand DSA • Min-Interference DSA • NP Hard 7 10 8 12 11 9
Input to the problem: • Interference Graph • Minimum and maximum demands of each node • Available number of channels Max-Demand DSA Maximize theoverall demands served among all base stations with the available number of channels such that no constraint is violated • Check if the minimum demands of all base stations can be served • If yes, serve as many demands as possible using available channels
dmin=2 Phase II: • Add dmax(i)-dmin(i) copies for each node ito construct Gmax • Pick as many independent sets as possible in Gmax Max-Demand DSA Algorithm Phase I: 2 2 1 2 1 1 3 3 4 3 4 4 G(V,E) Gmin(Vmin,Emin) • Pick K independent sets (IS) in Gmin • If all nodes in Gmin are picked proceed to Phase II
|OPT| |IS| δ 1 1- 1 δ e Max-Demand DSA Algorithm: Performance Guarantee • Interference Graph is modeled as a δ-degree bounded graph • When picking independent sets, pick the nodes in the order of maximum degree. • We can prove that • Phase II of the Max-Demand DSA achieves an approximation ratio of
Input to the problem: • Interference Graph • Maximum demands of each node • Available number of channels Min-Interference DSA 2 1 Max K Cut: Assign nodes to different colors so as maximize the number of edges between nodes with different colors 4 5 3 6 Minimize overall Interference when all demand (dmax) of the base stations are serviced 7 10 8 12 11 9
2 1 4 5 3 1 3 5 6 11 2 5 8 9 4 8 3 9 11 By a simple probability argument, we can prove that the weight of the cut (edges crossing partitions) produced by RK is 1-1/K of the optimal 6 dmax=2 K=5 7 10 1 2 7 10 4 10 6 7 8 12 12 12 11 9 Algorithm Rk for Multi-Color Max-K-Cut: For each node i, randomly pick dmax(i) different colors from the available K colors
Min-Interference DSA: TABU Search Algorithm • Start from the random solution • In each iteration, generate certain number of neighboring solutions • Pick the solution with least interference • Repeat until no improvement for certain number of iterations 1 3 2 7 10 1 4 10 3 5 6 11 6 7 2 5 8 9 4 8 9 11 12 12
Performance • Graph Based simulations with 1000 nodes • 40 - 240 channels • Demands 10 - 80 • Max-Demand DSA performs very well • Min-Interference DSA: Random 1/K • Min-Interference DSA: Tabu performs extremely well compared to Random
Future Work • Test our algorithm performance on realistic network topologies from existing service providers • Build an experimental spectrum broker simulator that accounts for advanced features of the CDSA model such as demand scope, stickiness, fairness etc.